Saturday, March 19, 2016

Gel Electrophoresis Lab

Jason
Trejo
Jordan

Purpose: The purpose of this lab was to run DNA through the process of gel electrophoresis using 3 restriction enzymes in order to characterize DNA. We were then meant to prepare and analyze our results based on the data we procured by running the DNA through the gel


Introduction: Restriction mapping is used to determine the size of DNA fragments. In gel electrophoresis, the smallest fragments will always travel a larger distance and the bigger fragments will travel a shorter distance.  The negatively charged end of the gel electrophorese repels the DNA moving it towards the positive end. Restriction maps of DNA are the equivalent to fingerprints, put alongside Lambda DNA as a size comparison and control, we were able to characterize the alien DNA.

Methods:
First of all we obtained a gel from our teacher and then we delicately proceeded to load the tiny wells with the contents of each reaction tube, containing DNA.  
(The prepared enzyme/DNA solutions and the Agarose gel.)

With my super technique I was able to skillfully use a needlepoint pipet to load the wells of the gel, being careful that the pipet is void of any air bubbles that could spill the solution.
(Agarose gel after DNA has been administered.)
(Agarose gel being cast into the electrophoresis tank)
The negatively charged phosphate backbone of the DNA allows for it to move through the pores of the heated Agarose gel, towards the positively charged anode at the opposite end of the wells. The lighter fragments move farther because they can squeeze through pores more easily and are faster due to their lighter weight.
   
The completed gel electrophoresis under an orange lamp that allows us to have a better look at where the fragments ended up on the gel. We used sharpie on a plastic Baggie to emphasize the cut points and label the respective enzyme/DNA solutions for easier reference. Cut sites had to be estimated, so the numbers were not adding up to be equal, however the concept and relative lengths of each fragment was understood and noted.

Data:


Discussion: Through gel electrophoresis we were able to obtain enough data to map the plasmid and discovered that the DNA sequence was cut by the restriction enzymes on several occasions. There were two PstI sites , one SspI site, and one HpaI site on the plasmid. Compared to the Lambda DNA, this mystery DNA had much shorter fragments when PstI was administered.


Conclusion: Although our cut sites and fragment lengths did not necessarily add up correctly, we were still able to insert estimated numbers and create a plasmid displaying the data we procured. We were able to determine the enzyme cut sites alone, and in relation to each other during the double and triple digests. The smaller bands move through the gel more quickly due to their size, so we were able to make educated guesses on the positions of cut sites with given number data.

Sunday, February 28, 2016

pGLO Transformation Lab Report

Purpose:
The purpose of this lab was to study transformation and the effect that integrating certain genes into a typical E. Coli bacteria would have on the cell. This lab also explored the effect that certain environments would have on the bacteria, including those containing antibiotics or certain sugar molecules, as well as how the introduced gene would interact with these environments.

Introduction:
Genetic transformation is a change caused by the introduction of a gene, and how it is incorporated into a cell’s DNA sequence. Once this particular gene is added into the DNA, it can code for related mRNAs that code for particular proteins that give the cell different properties than it had before. This transformation can be helpful or harmful, depending on the DNA sequence introduced into the cell.

Methods:
To begin with, we labeled one closed micro test tube +pGLO and another -pGLO, to indicate which E. Coli bacteria would be given the chance to incorporate the gene into its DNA.
+pGLO tube
-pGLO tube

Afterwards, 20 microliters of transformation solution was transferred into each tube using a sterile transfer pipet, segmented into 10 microliter segments. With the transformation solution in hand, the tubes were iced.
Ice to meet you, micro test tubes...

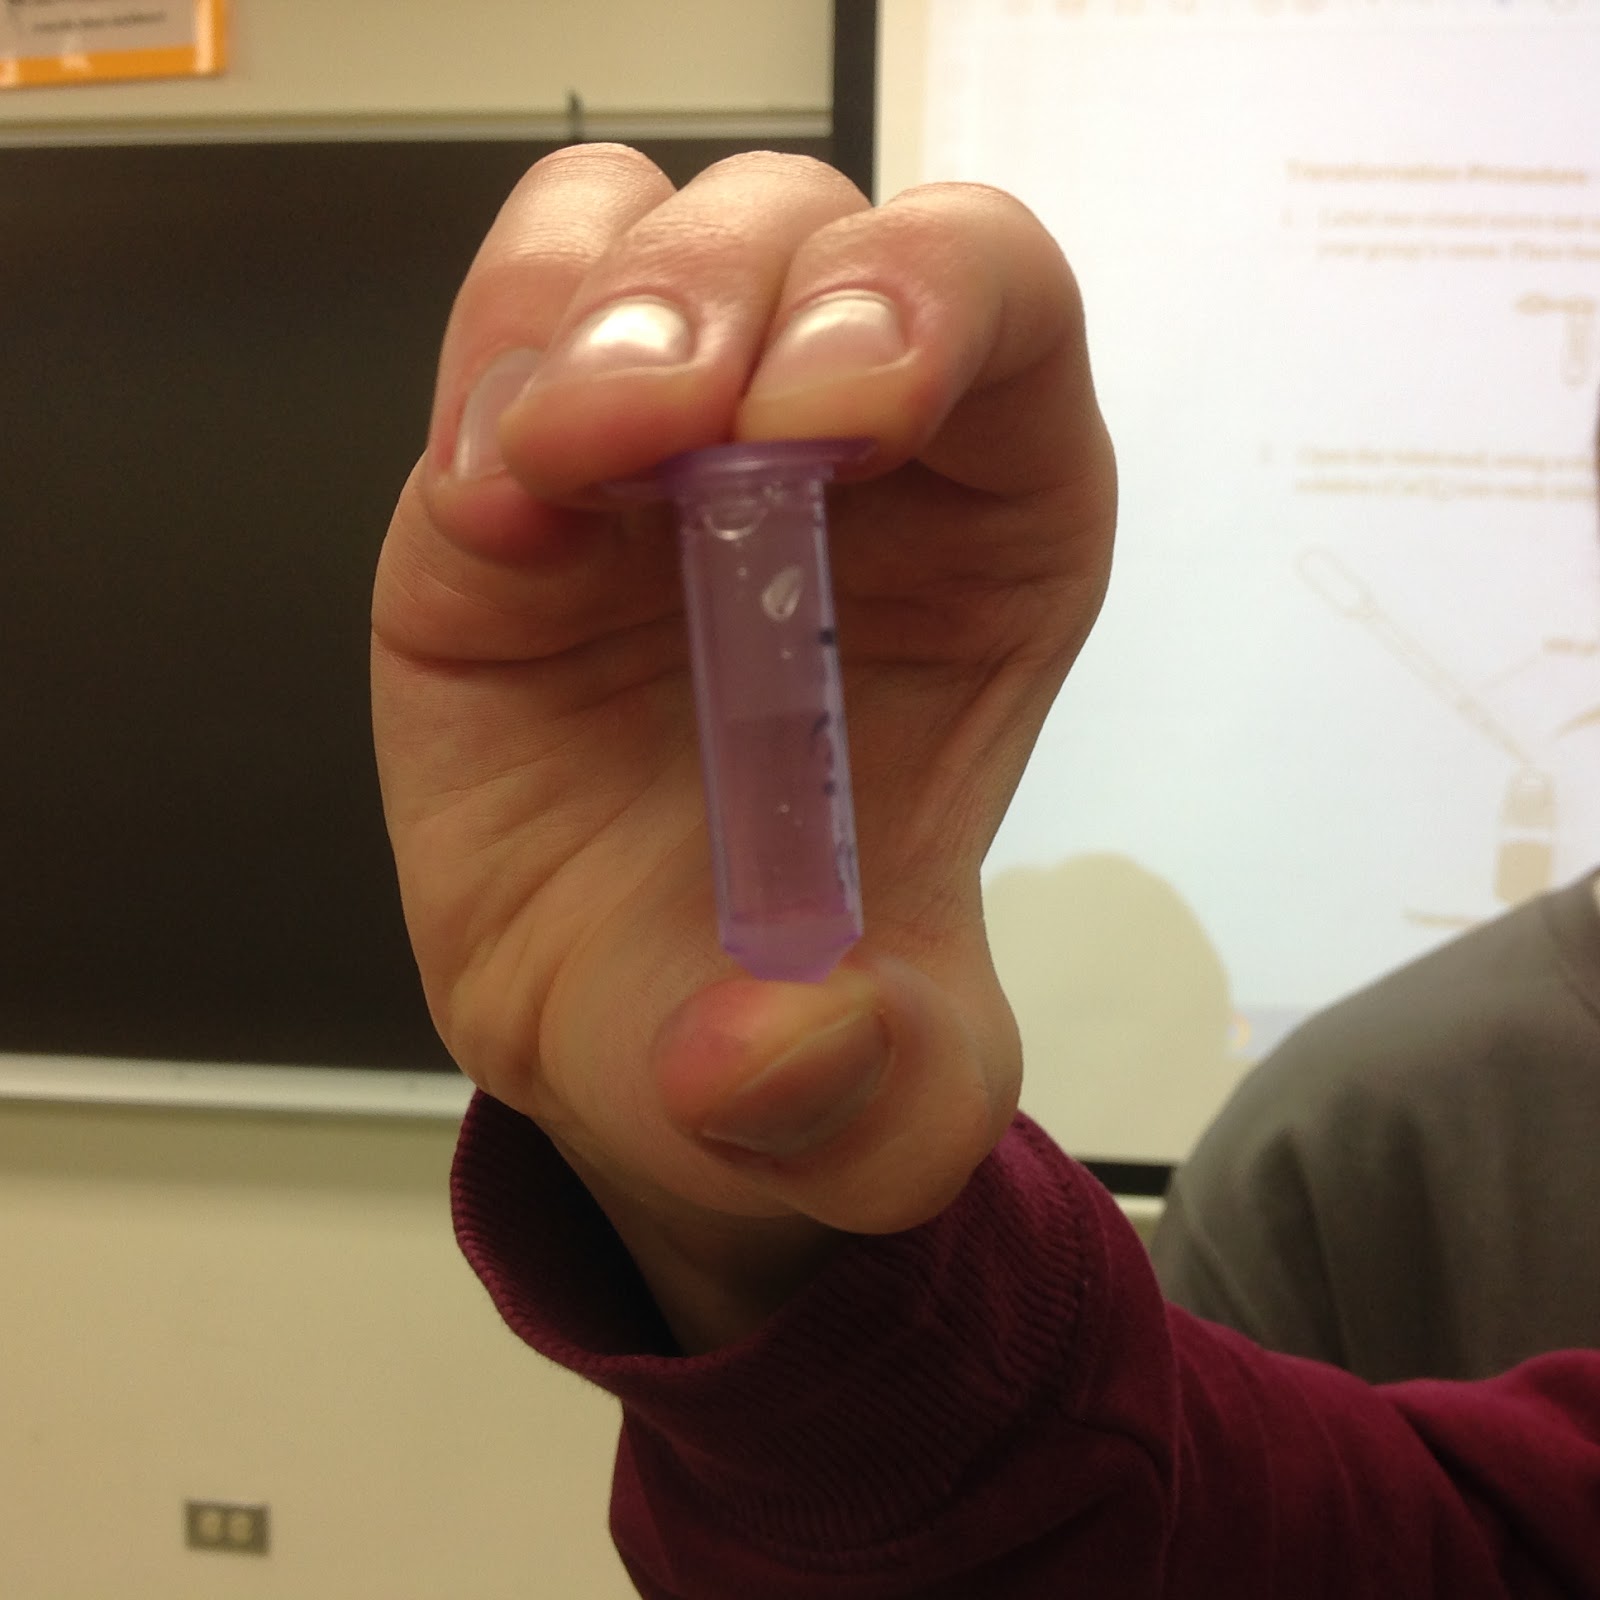
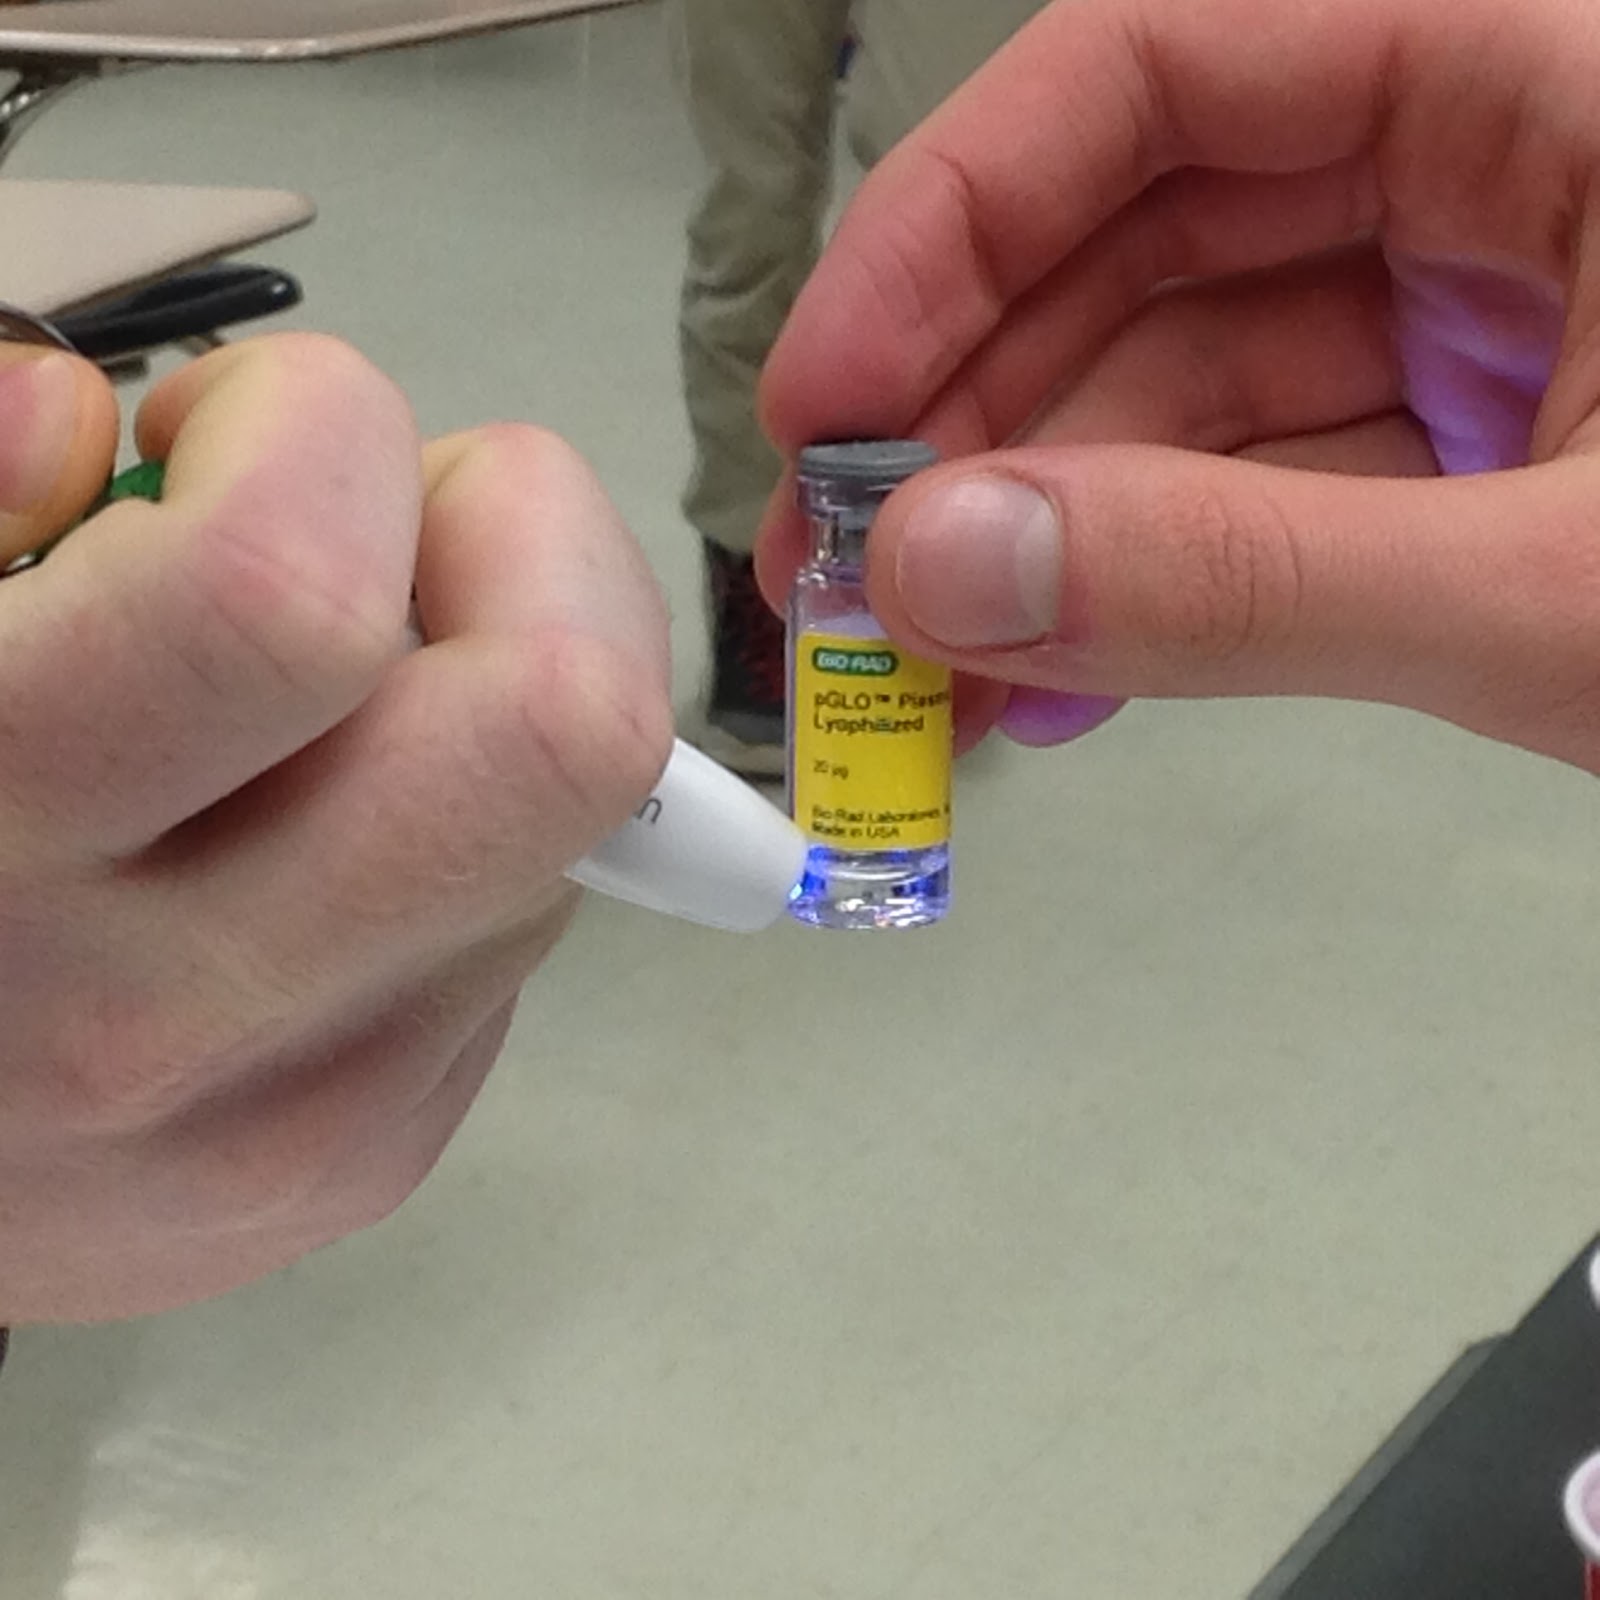
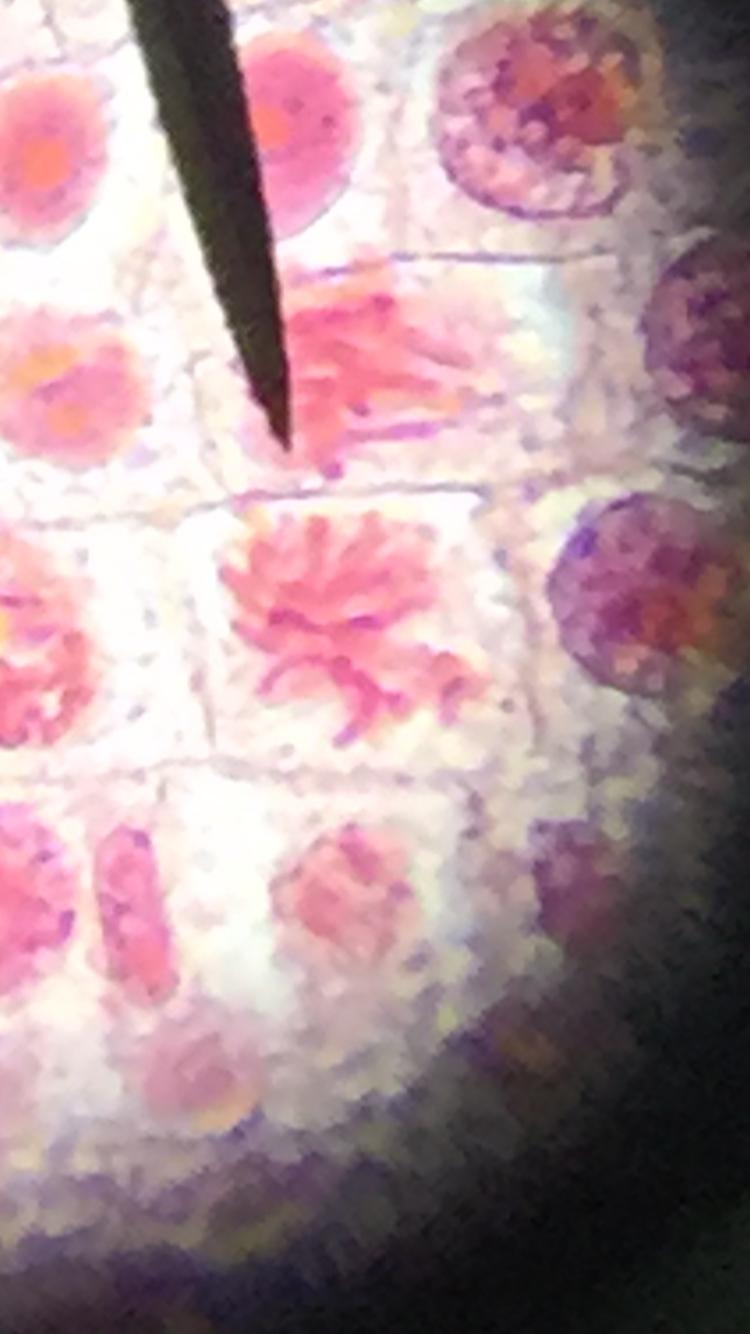
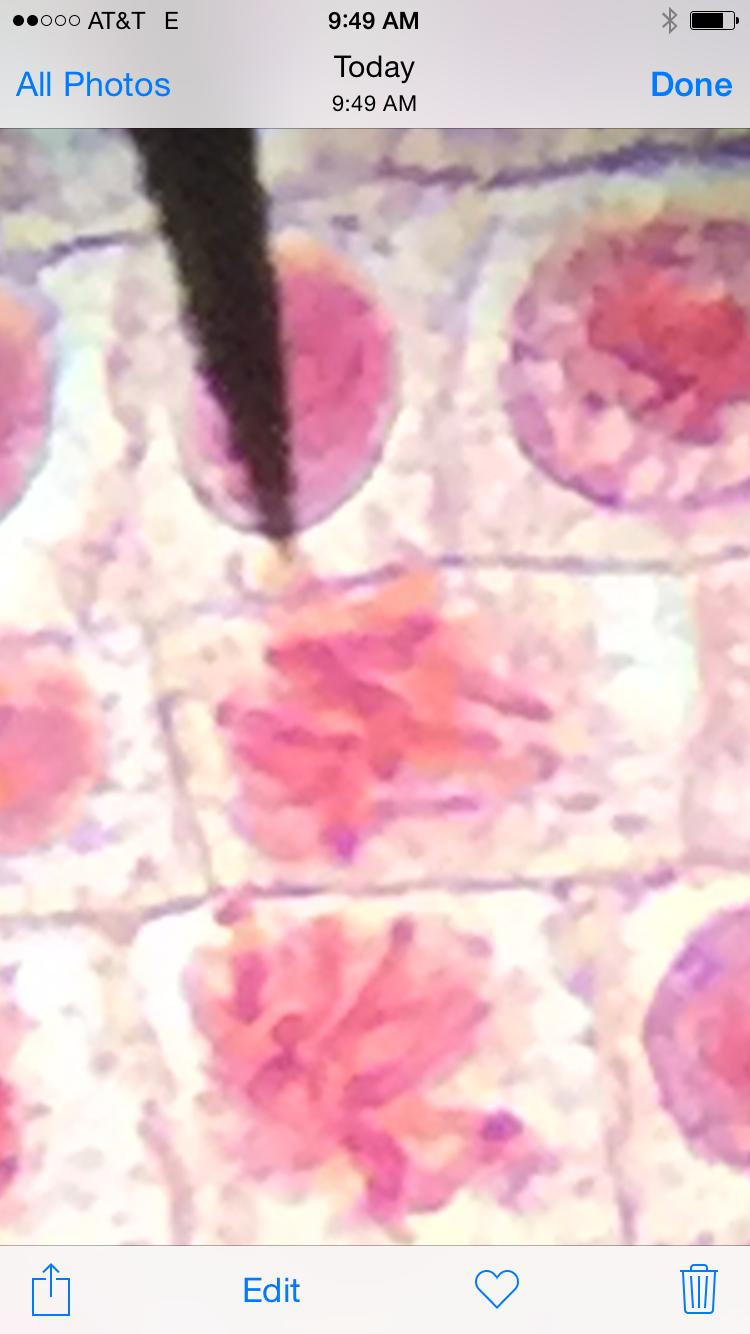
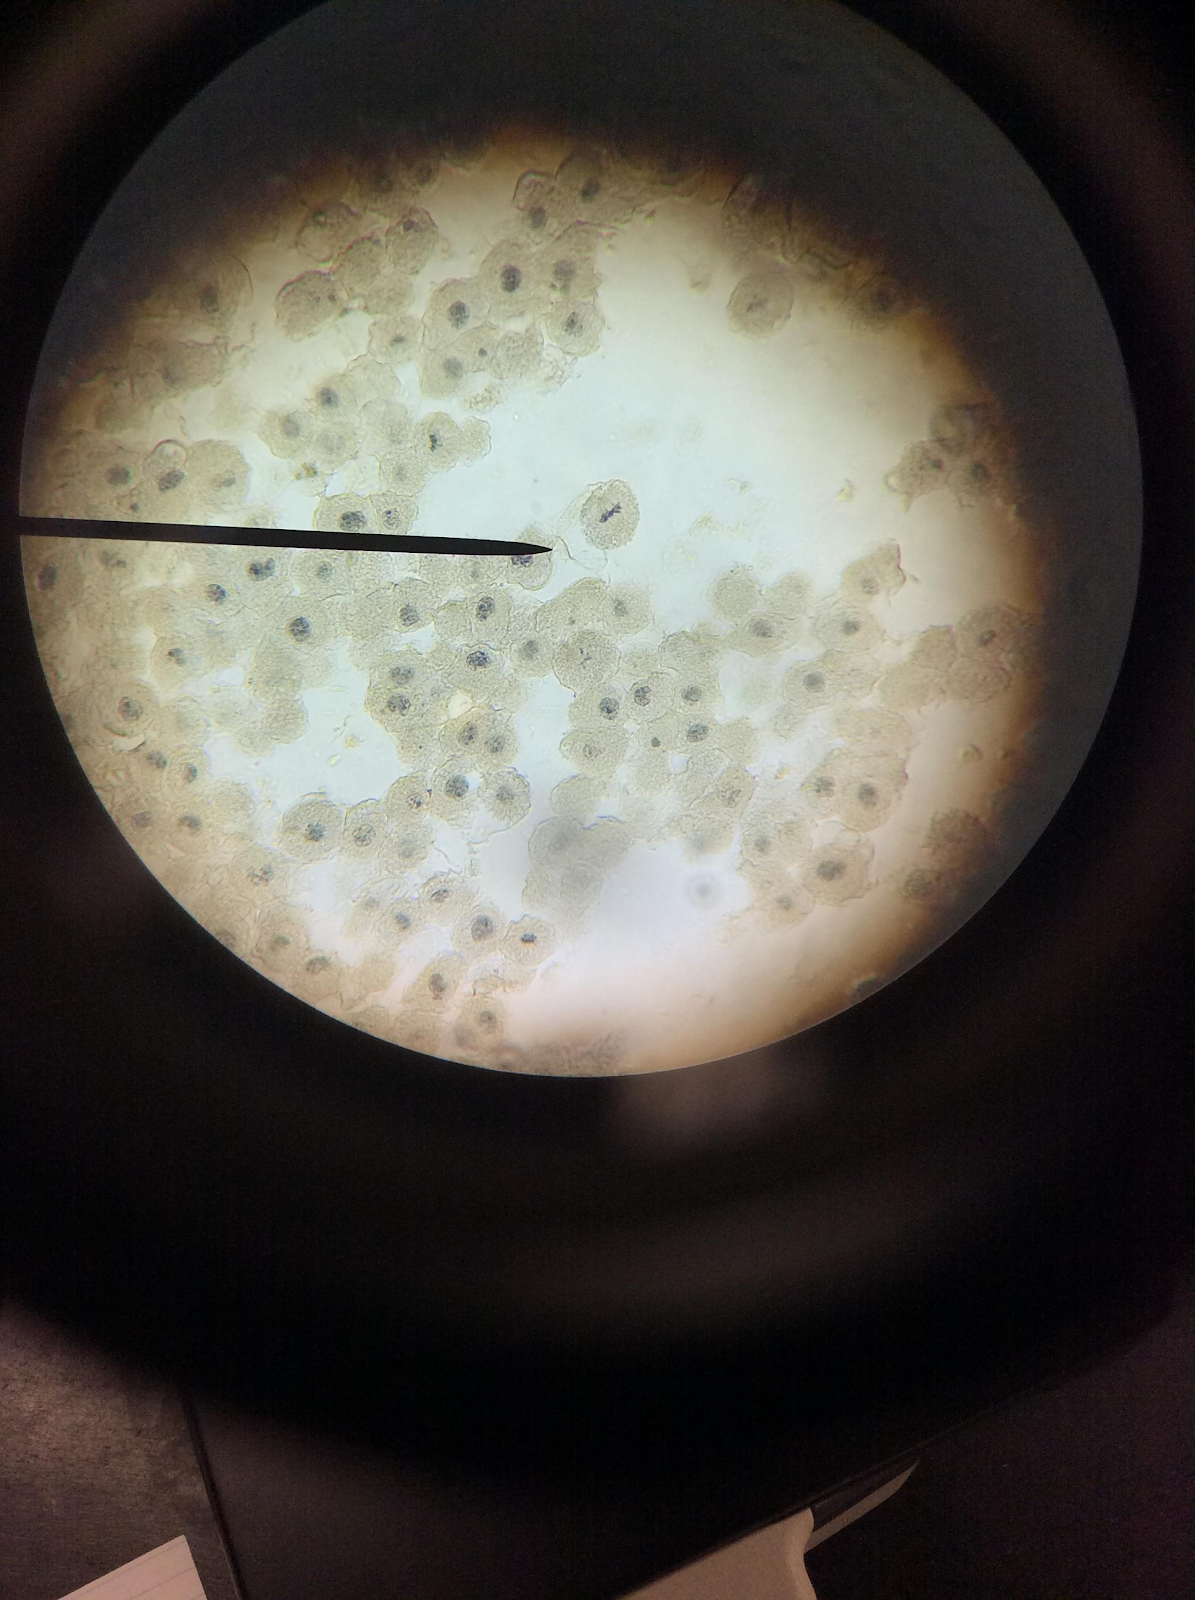
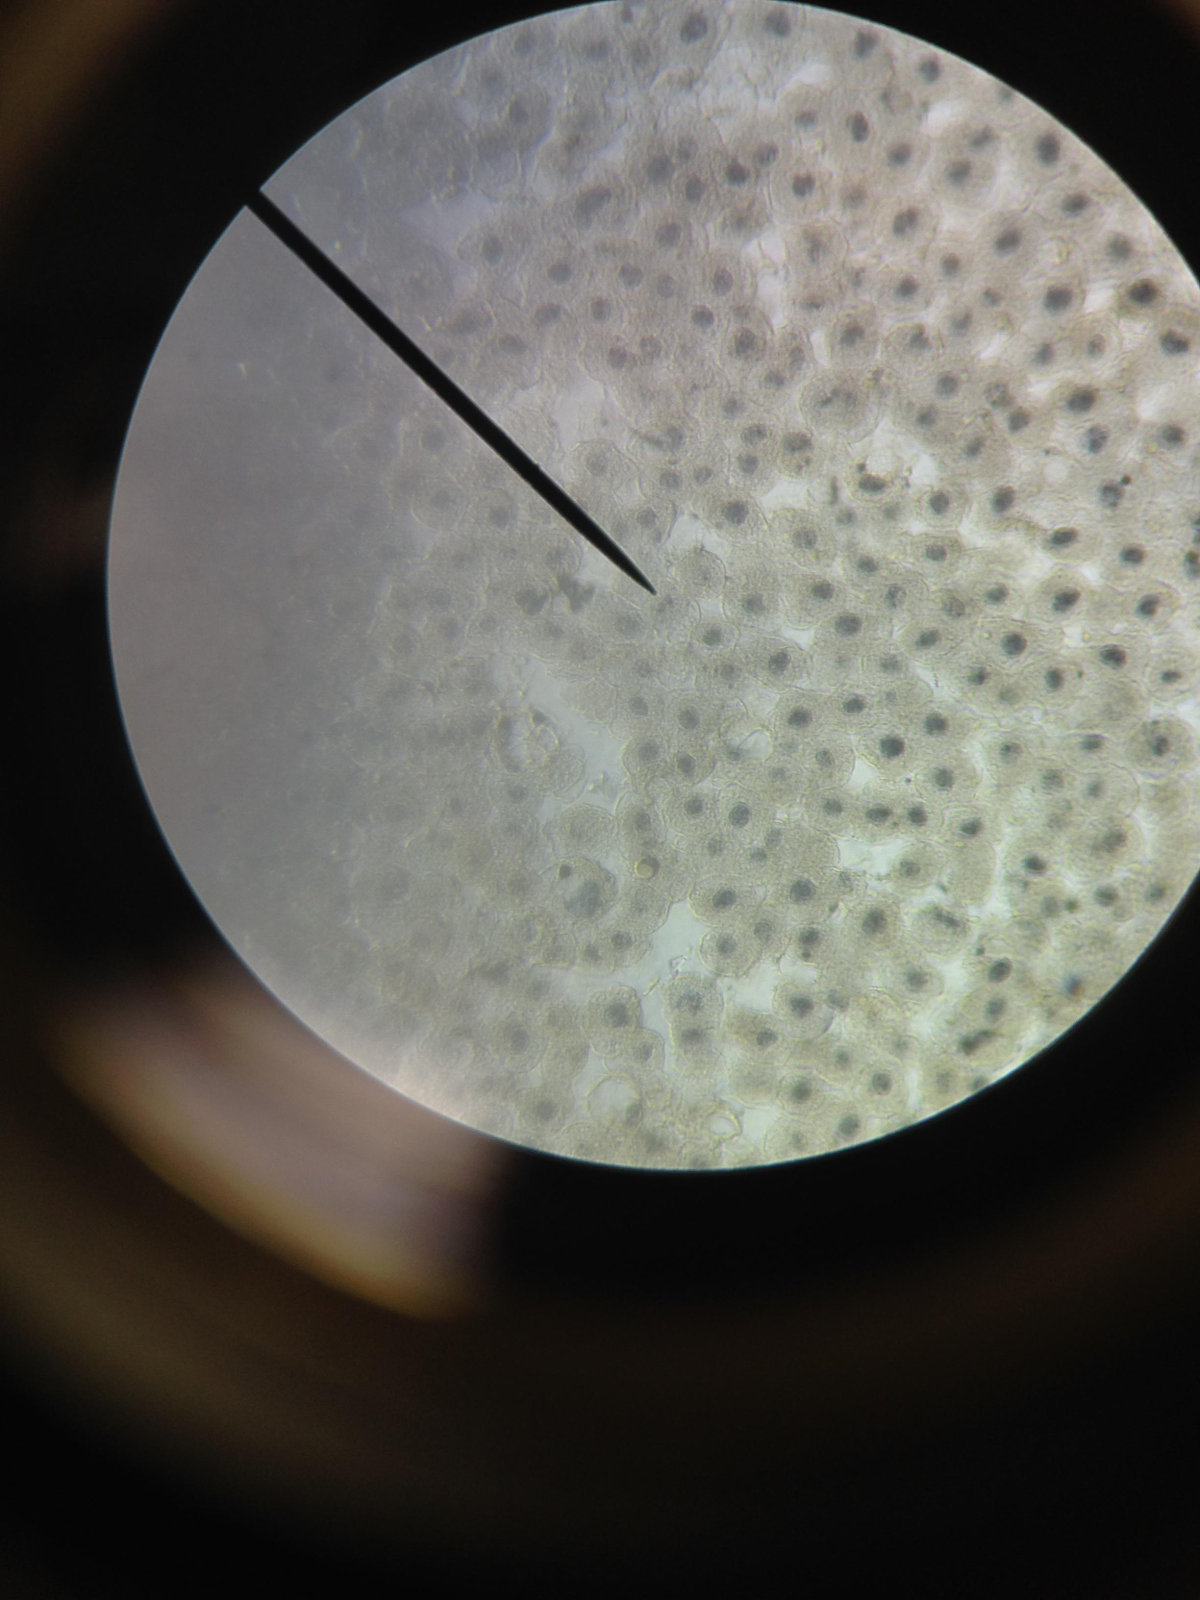
Next, we used a sterile loop to transfer a colony of E. Coli bacteria into each of the test tubes. The loop was spun thoroughly to fully incorporate the colony into each of the tubes. Afterwards, we used a UV light to determine that E. Coli was unable to glow on its own. Just after this was done, we used a different loop to incorporate pGLO plasmid DNA into the +pGLO tube, and noted that the solution (but not the bacteria) in the +pGLO tube glowed under UV light, but the -pGLO tube did not (as it should!).
Our reports show that the tube without any pGLO DNA does not, in fact, glow…

But the tube with the pGLO does. Shocking!

Also, note that the pGLO does glow on its own. So there’s no eldritch magicks at play here.
Hard to tell, I know, but this solution of pGLO DNA is glowing.

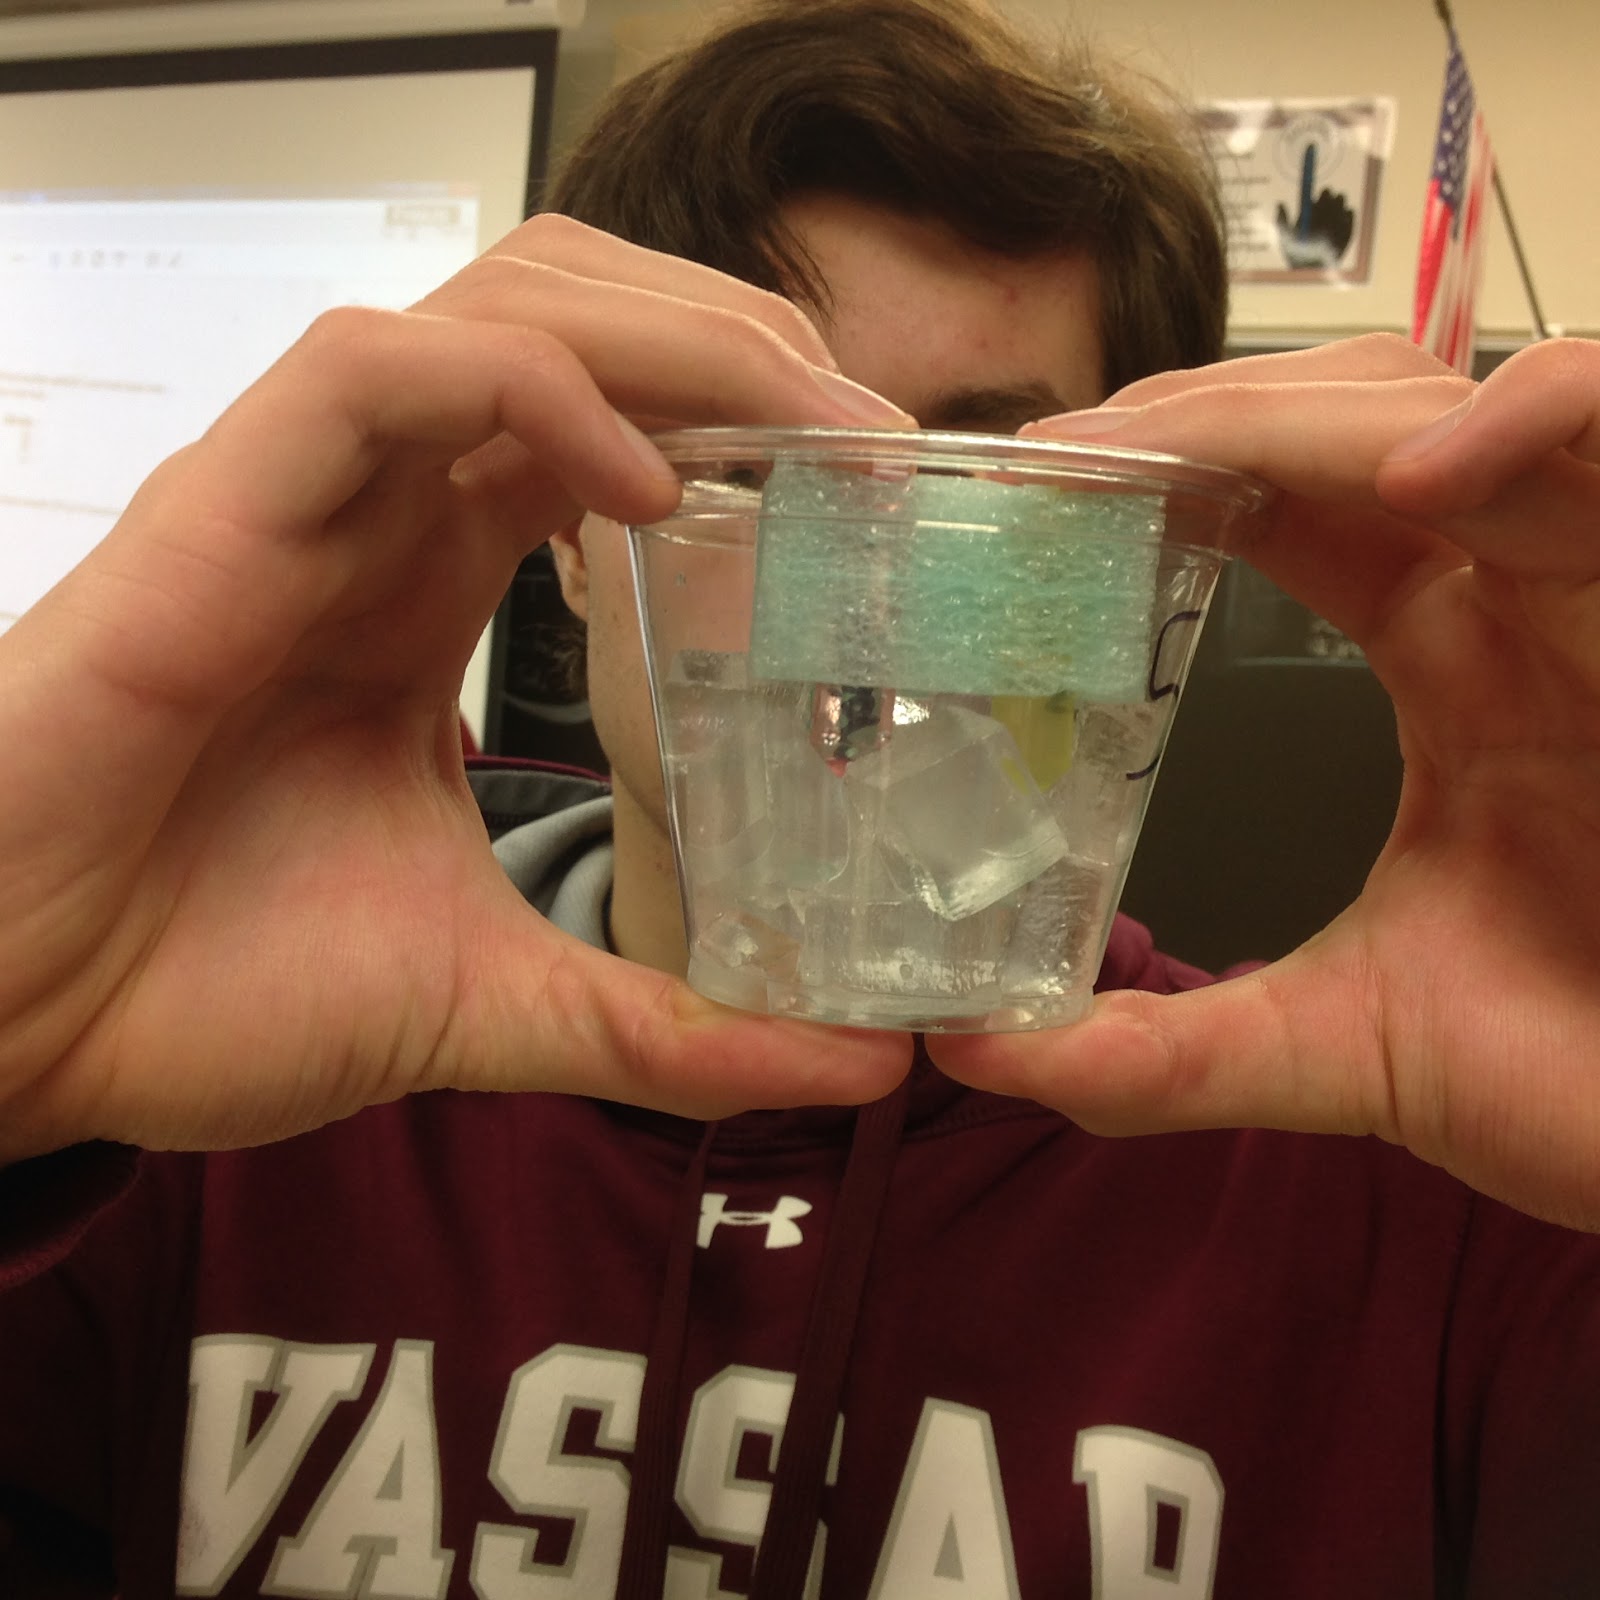
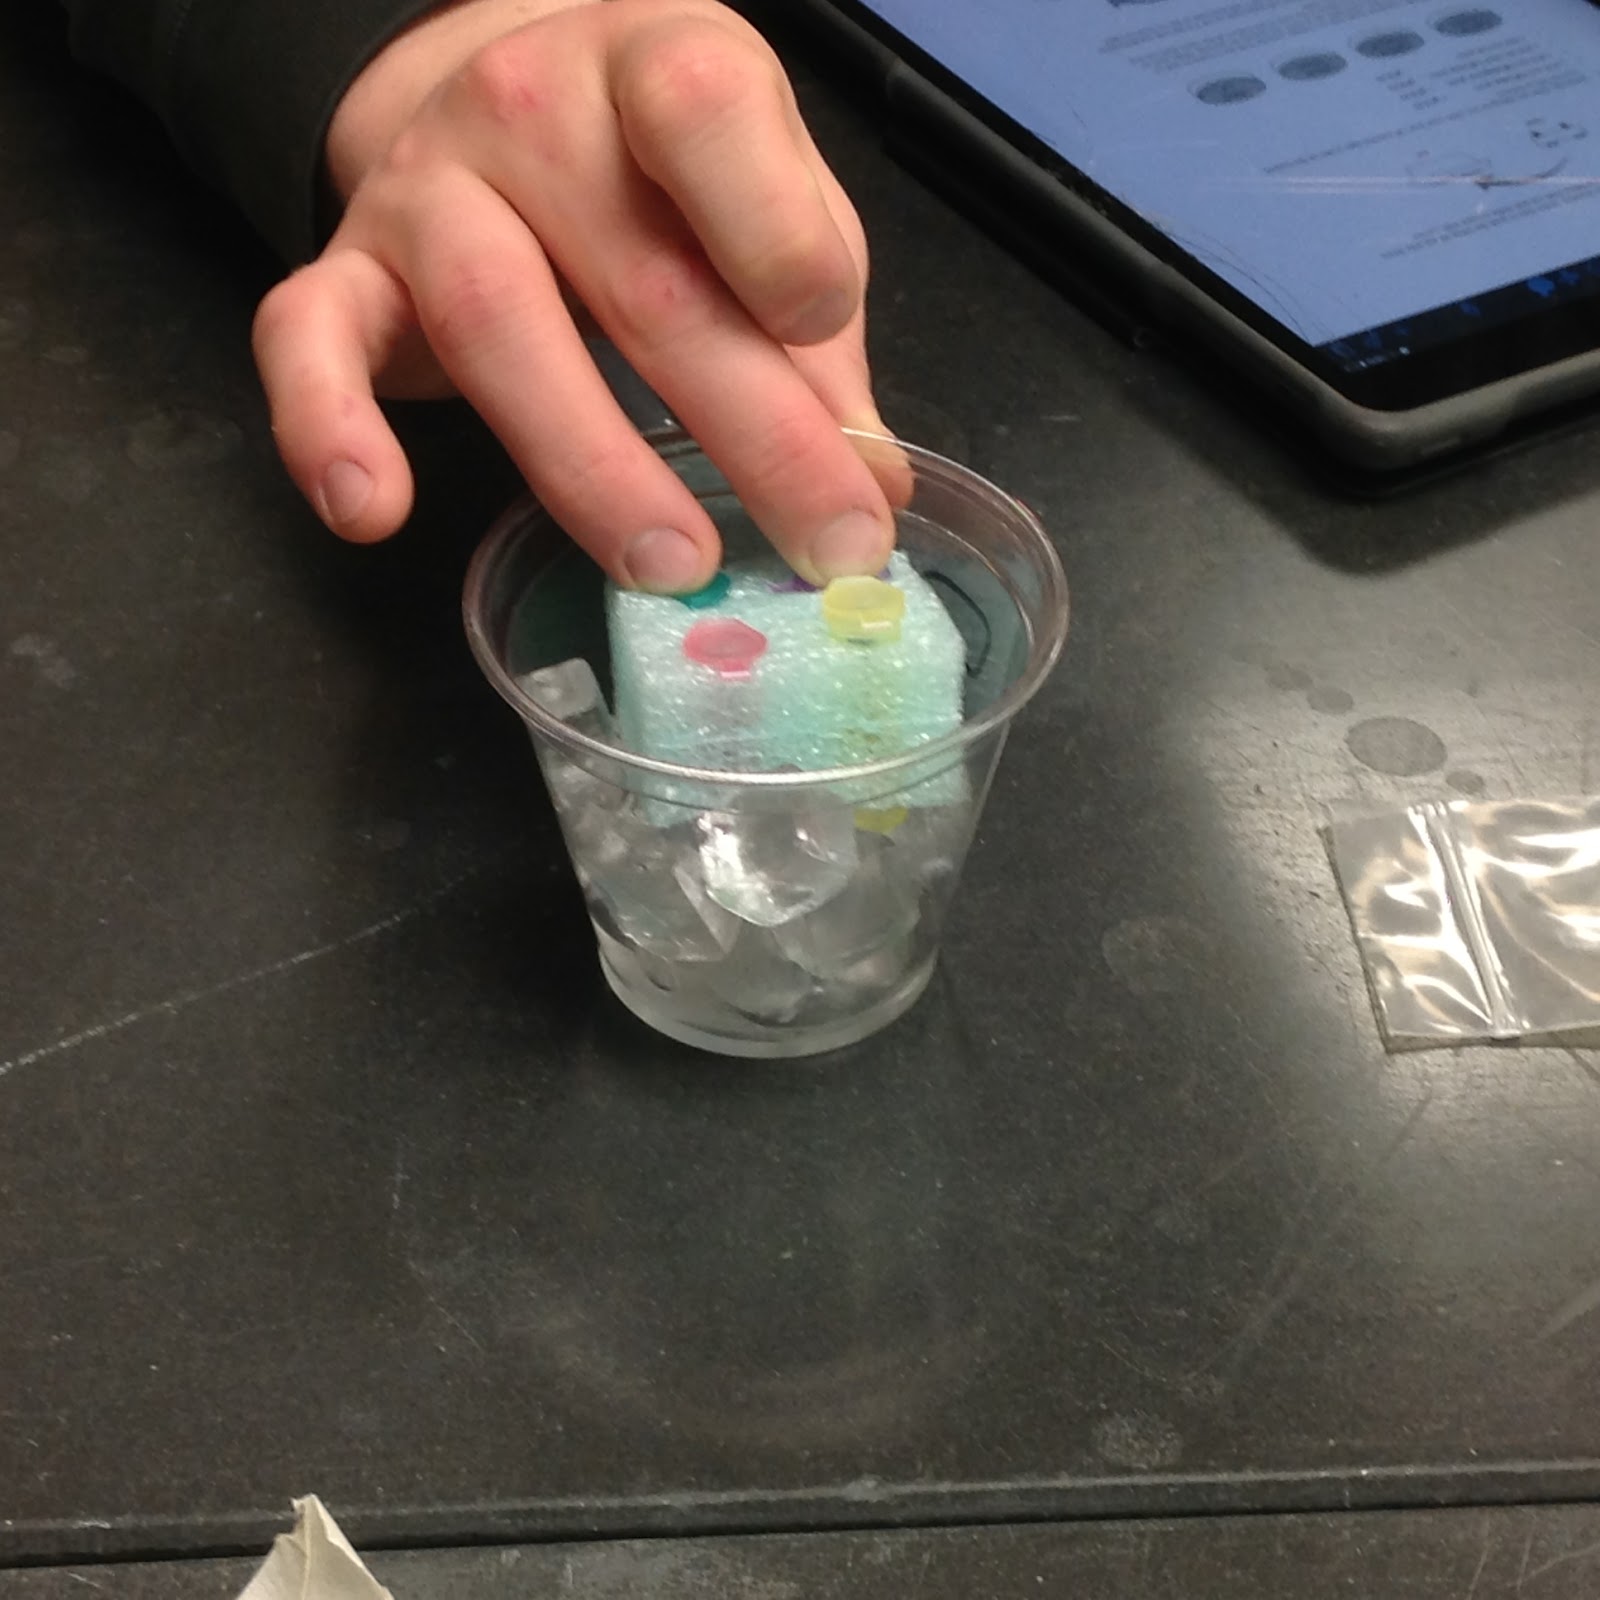
Once this was completed, it was back to the ice for ten minutes.
Ice day today, isn’t it?

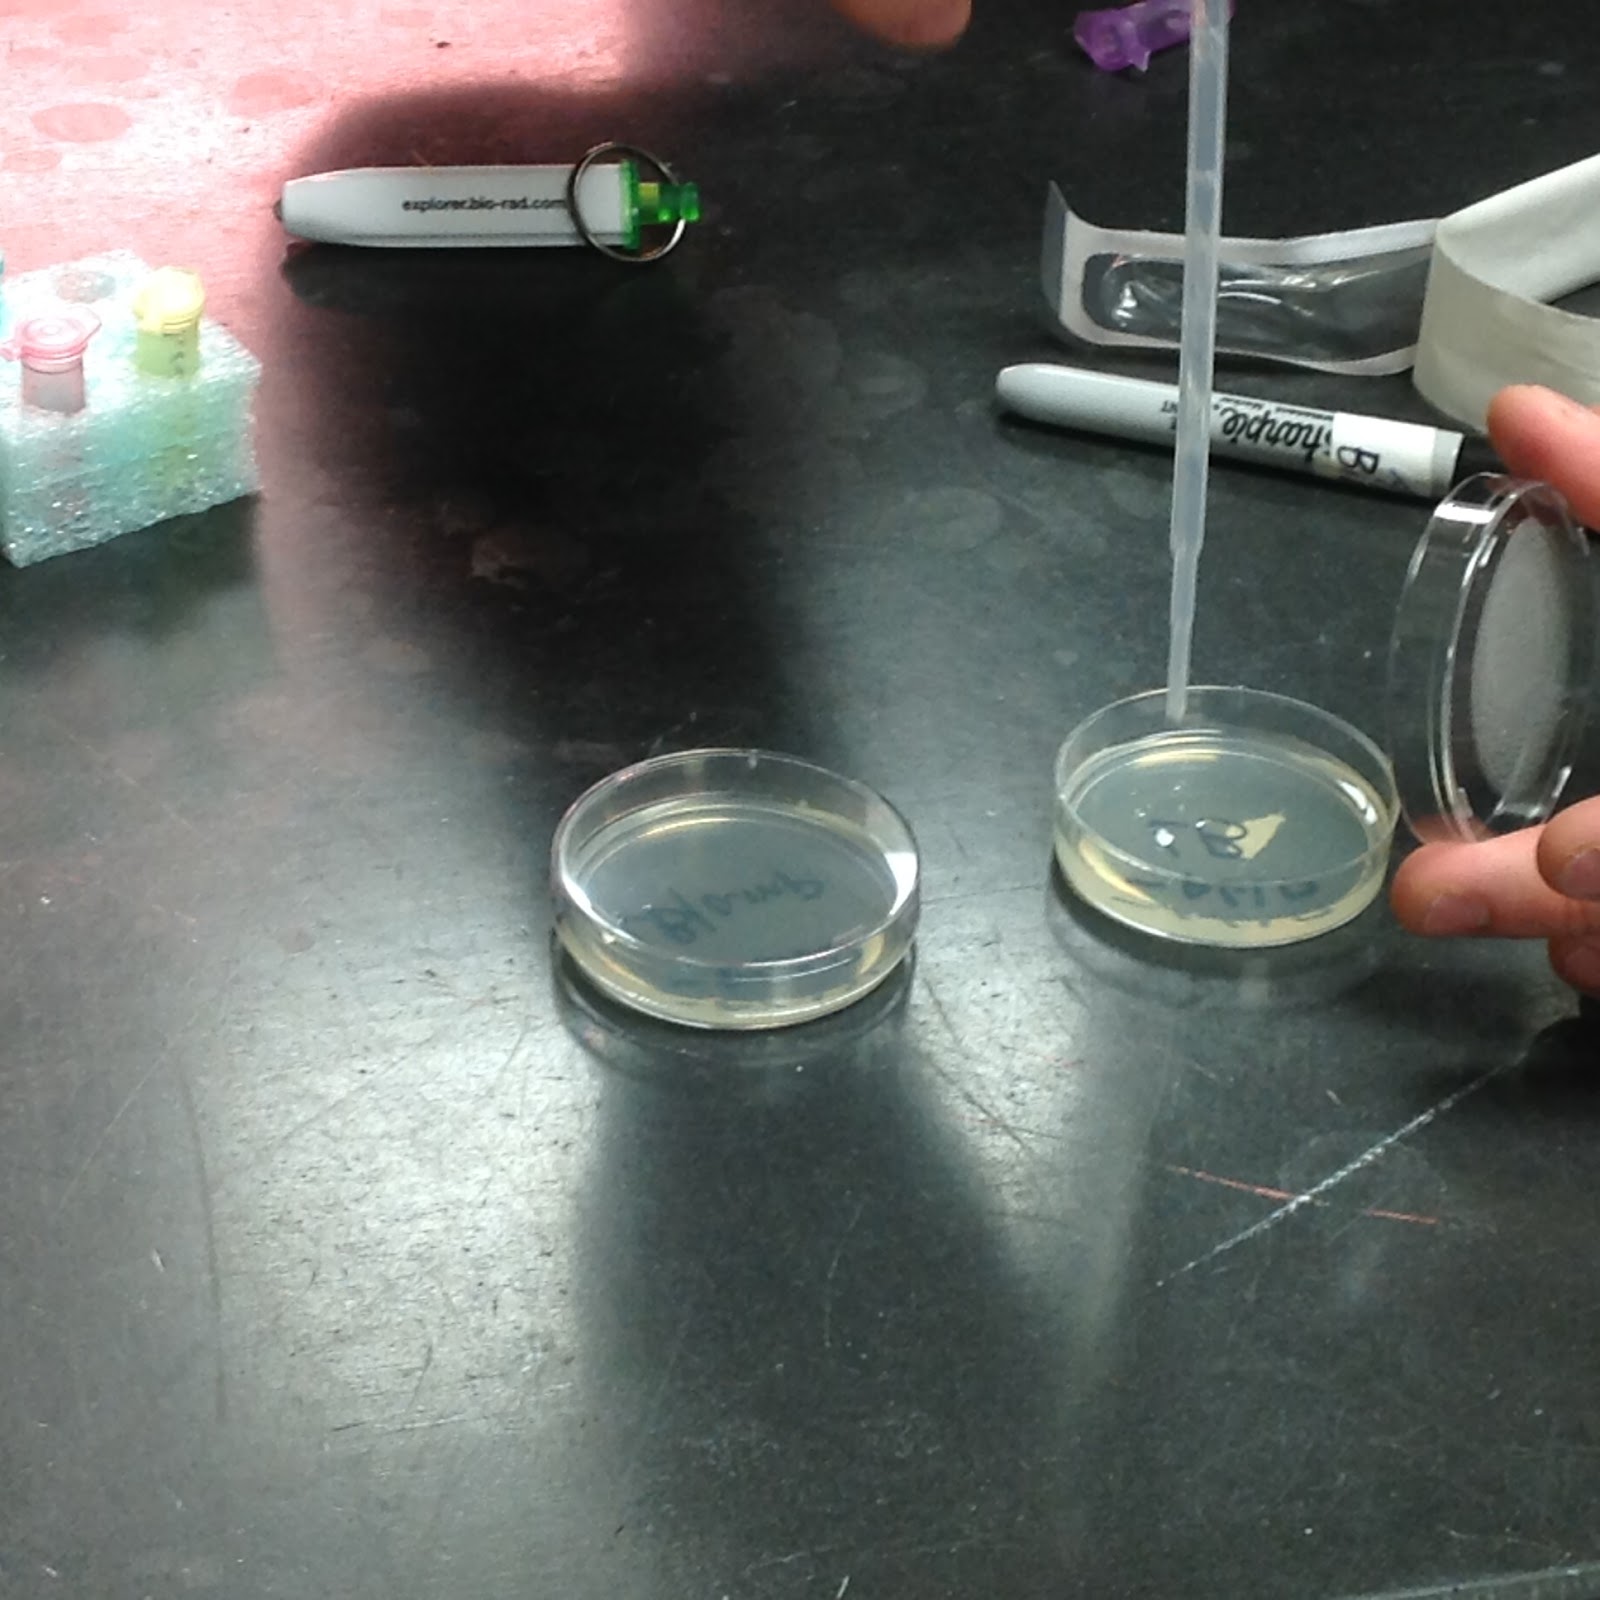
Meanwhile, we gathered the LB nutrient agar plates that we would use to culture more bacteria. They were already pre-labeled and pre-made, so we didn’t really need to worry about differentiating them.
Oh hi plates.

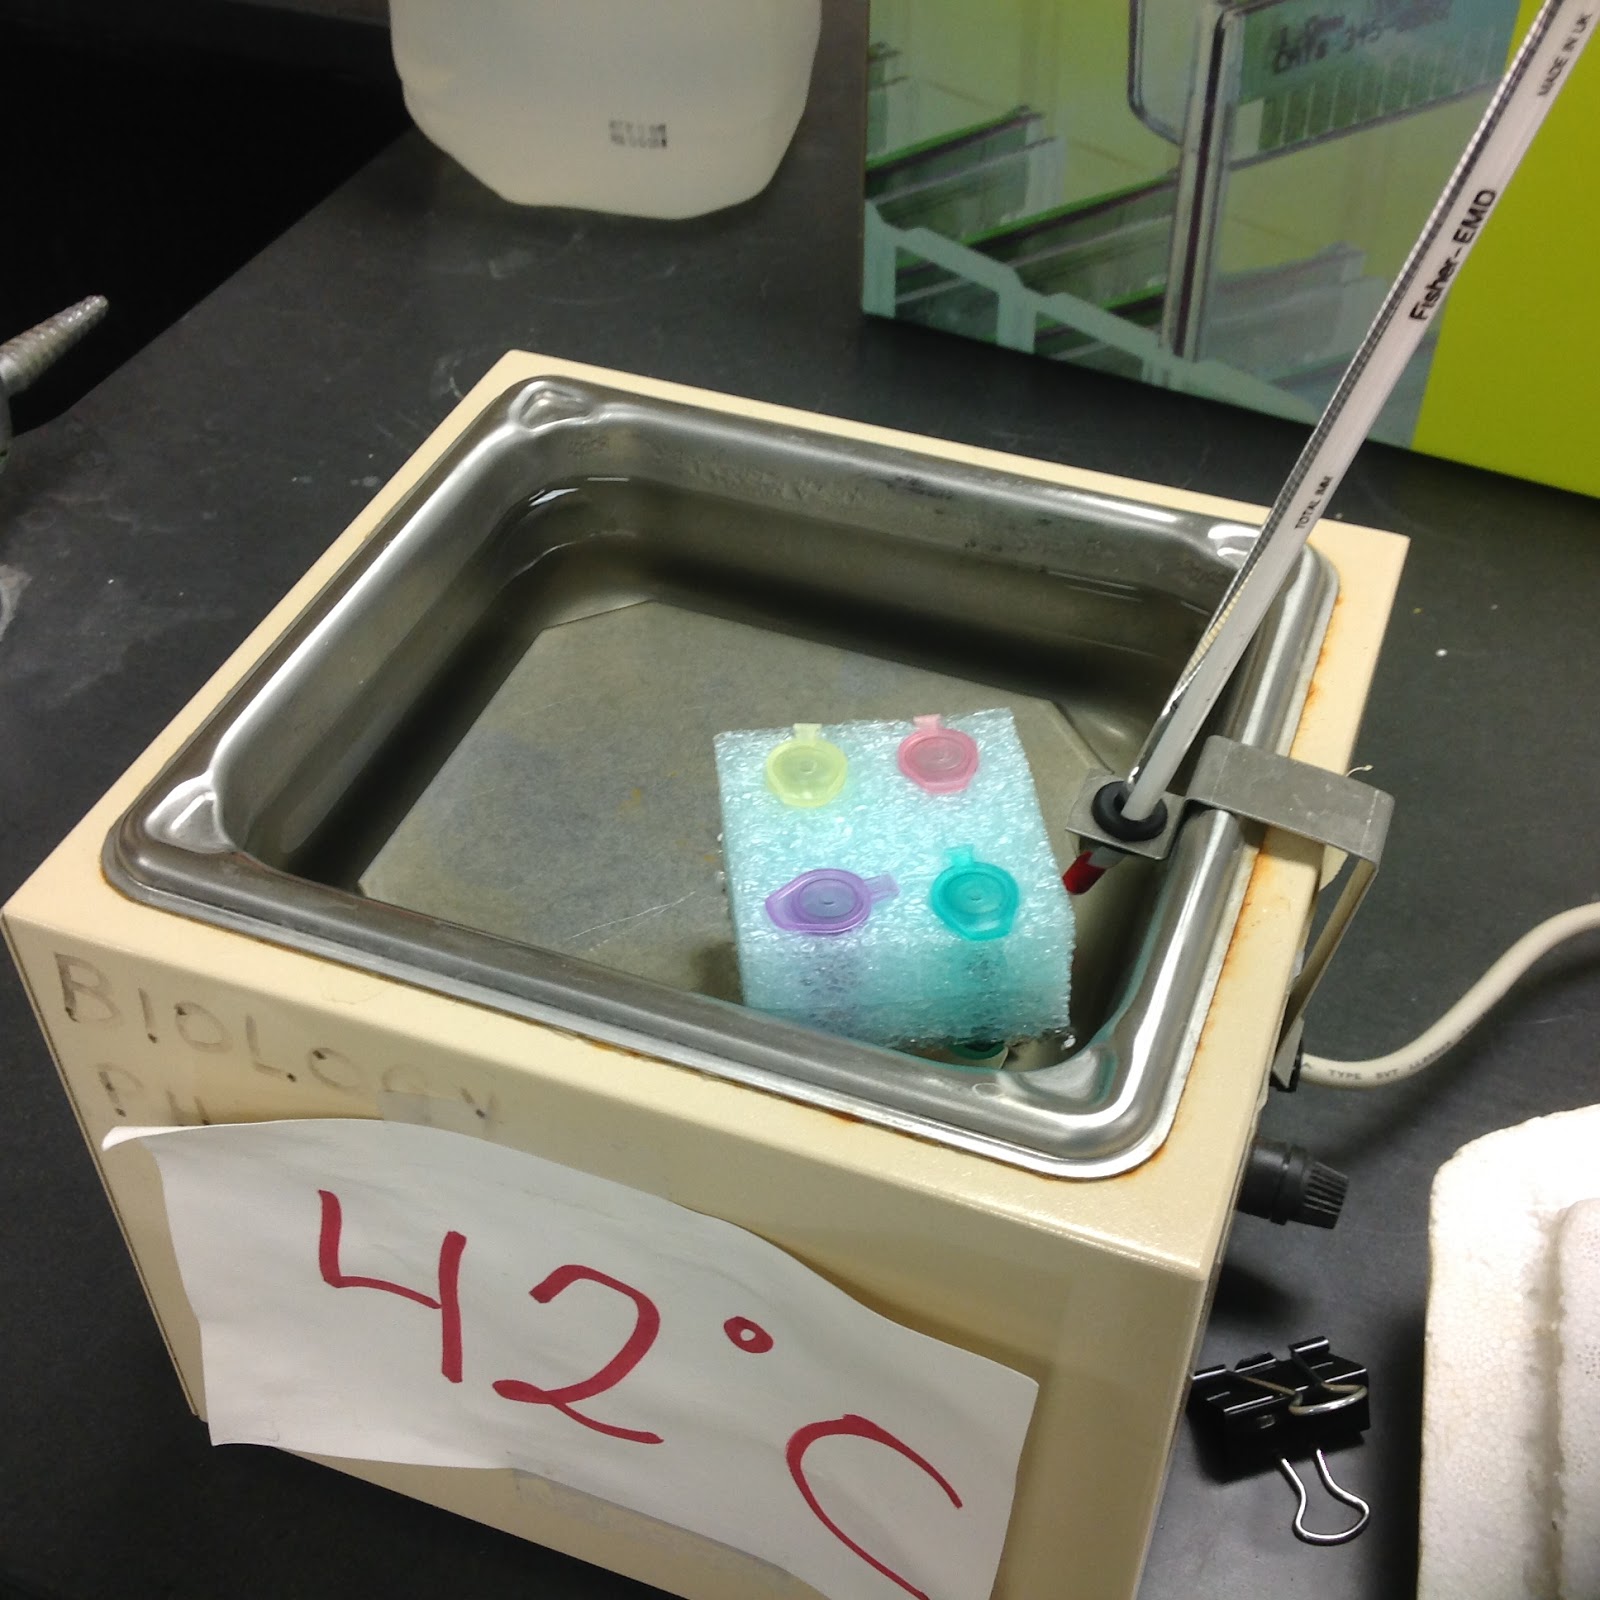
Next came the heat shock! We removed the tubes from the ice and put them in 42 degrees Celsius water for 50 seconds.
HEAT SHOCK

After that, we put the tubes back on ice for two minutes to seal the E. Coli’s breached membranes with, hopefully, the pGLO integrated into the ones in the +pGLO tube. Once that was completed, we added 250 microliters of nutrient broth to the tubes, closed them, and mixed the solutions together by tapping the side of the tube. We then incubated them for ten minutes at room temperature.

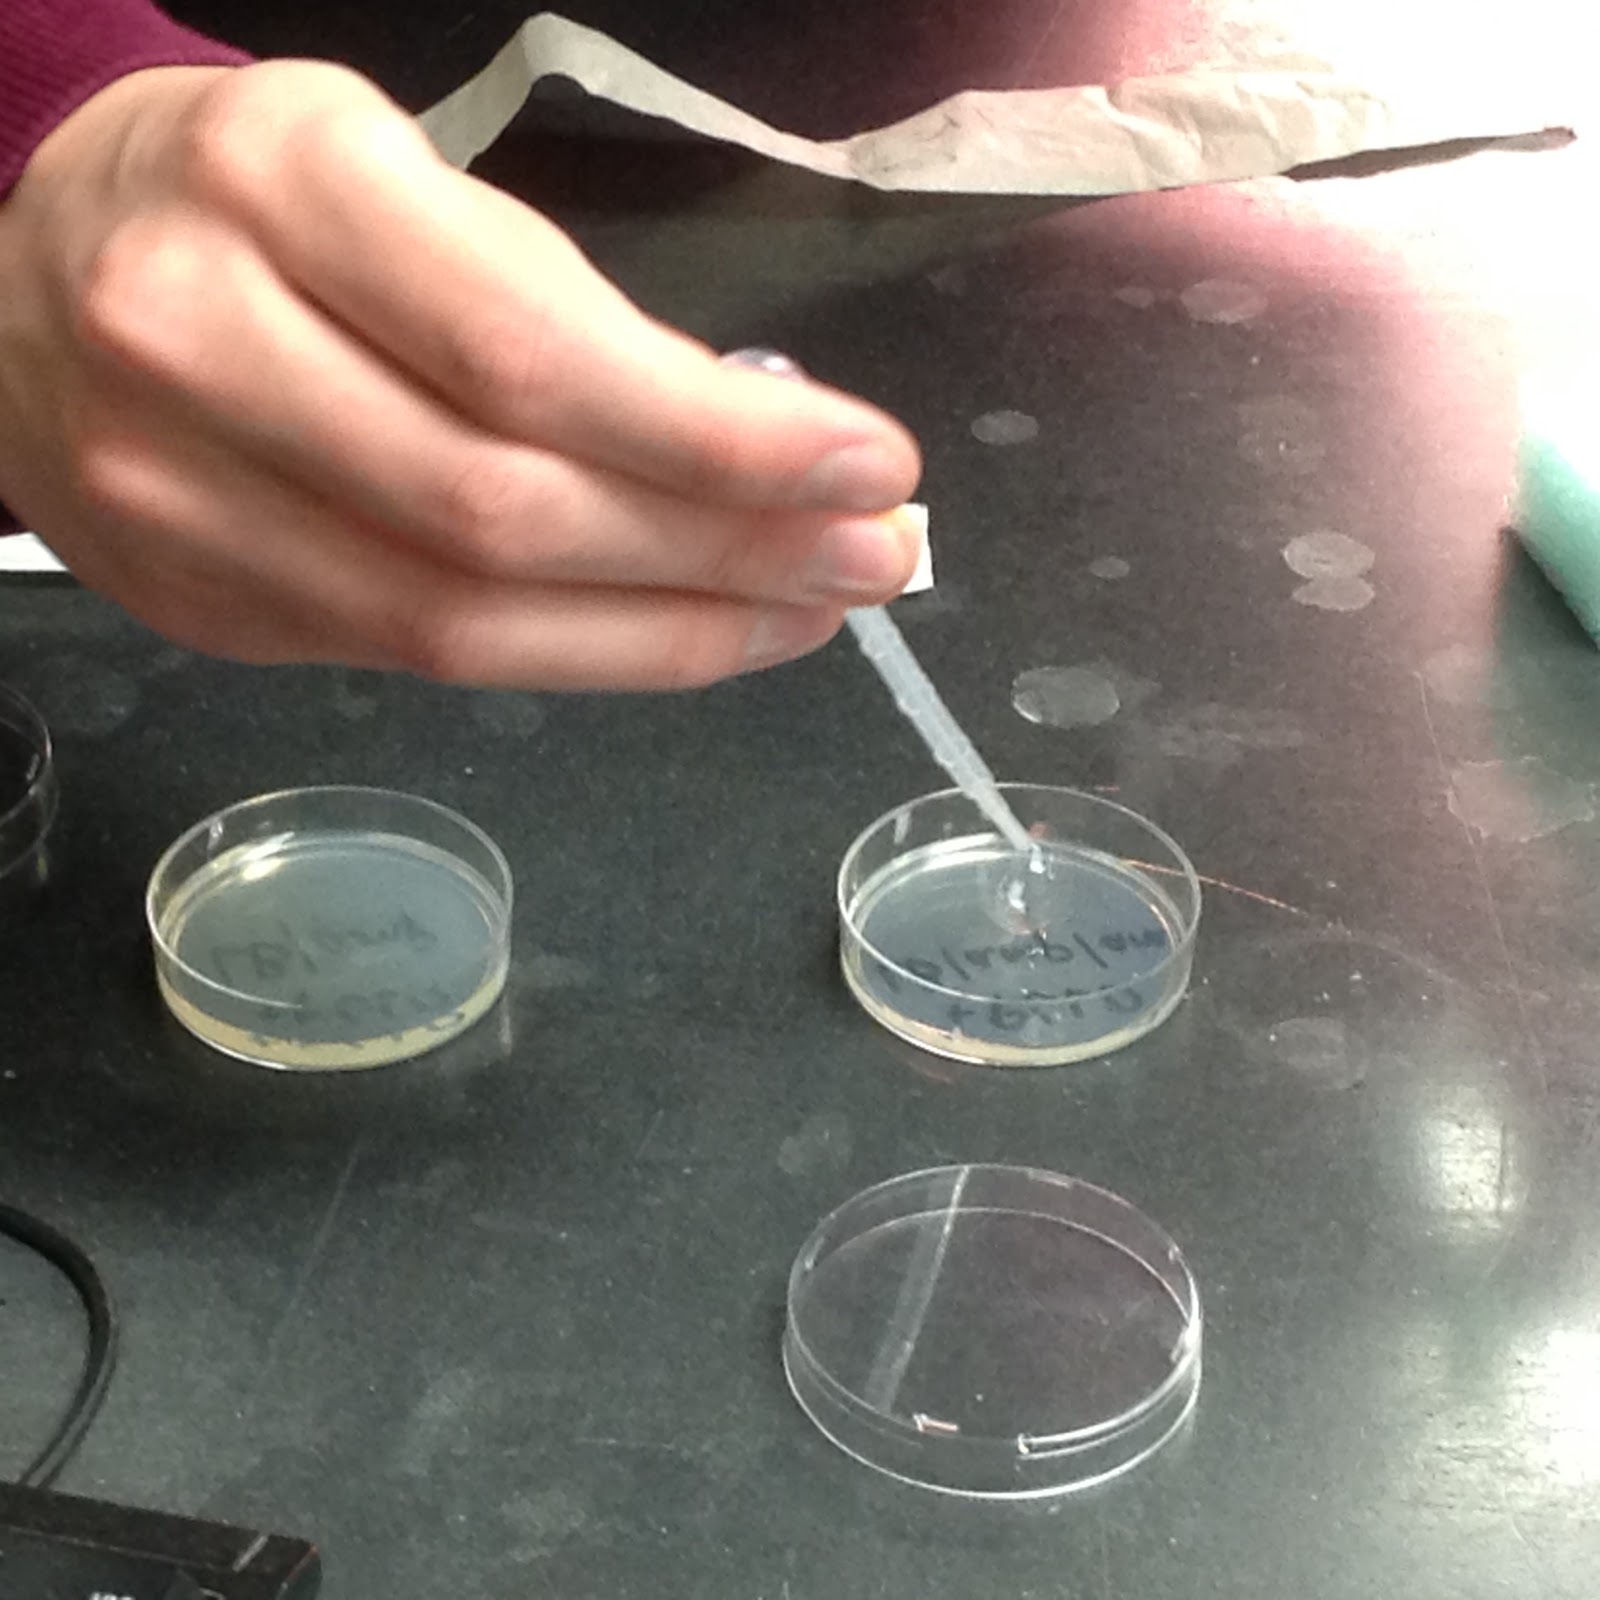
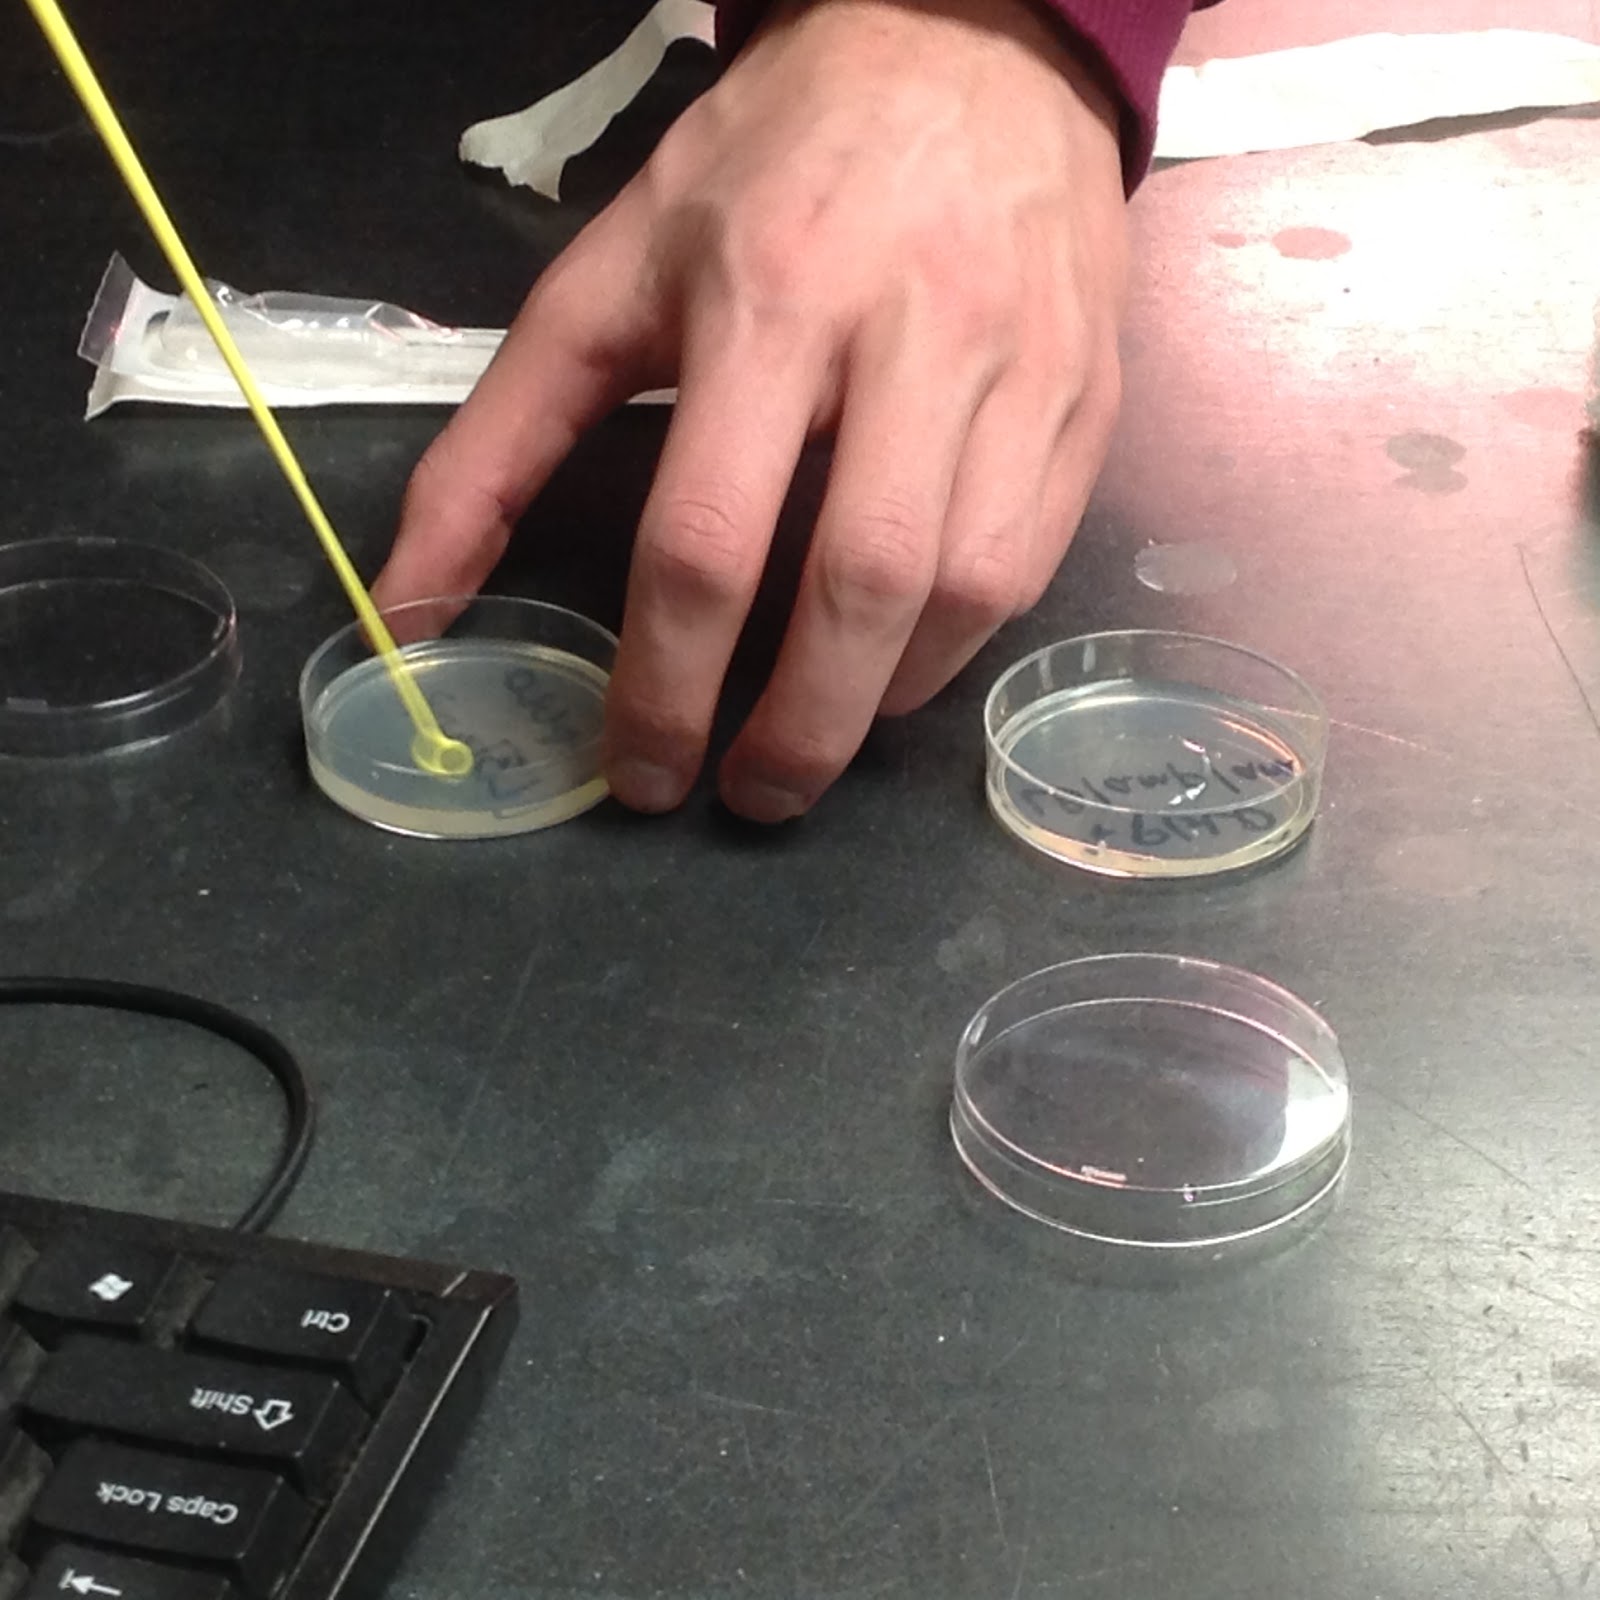
All that was left after that was to pipet 100 microliters of each solution onto their respective plates. The +pGLO tube was pipetted onto the +pGLO plates, one with LB and amp and the other with LB, amp, and ara. The -pGLO tube was pipetted onto the -pGLO plates, one with LB/amp and the other just with LB. Using a sterile loop for each plate, we spread the solutions along the surface of each plate to fully disperse the bacteria into their new home.
The process of integrated the bacteria into their new environments

Once that was done, we stacked up the plates upside down and incubated them for a day to allow the bacteria to grow.
Topsy-turvy

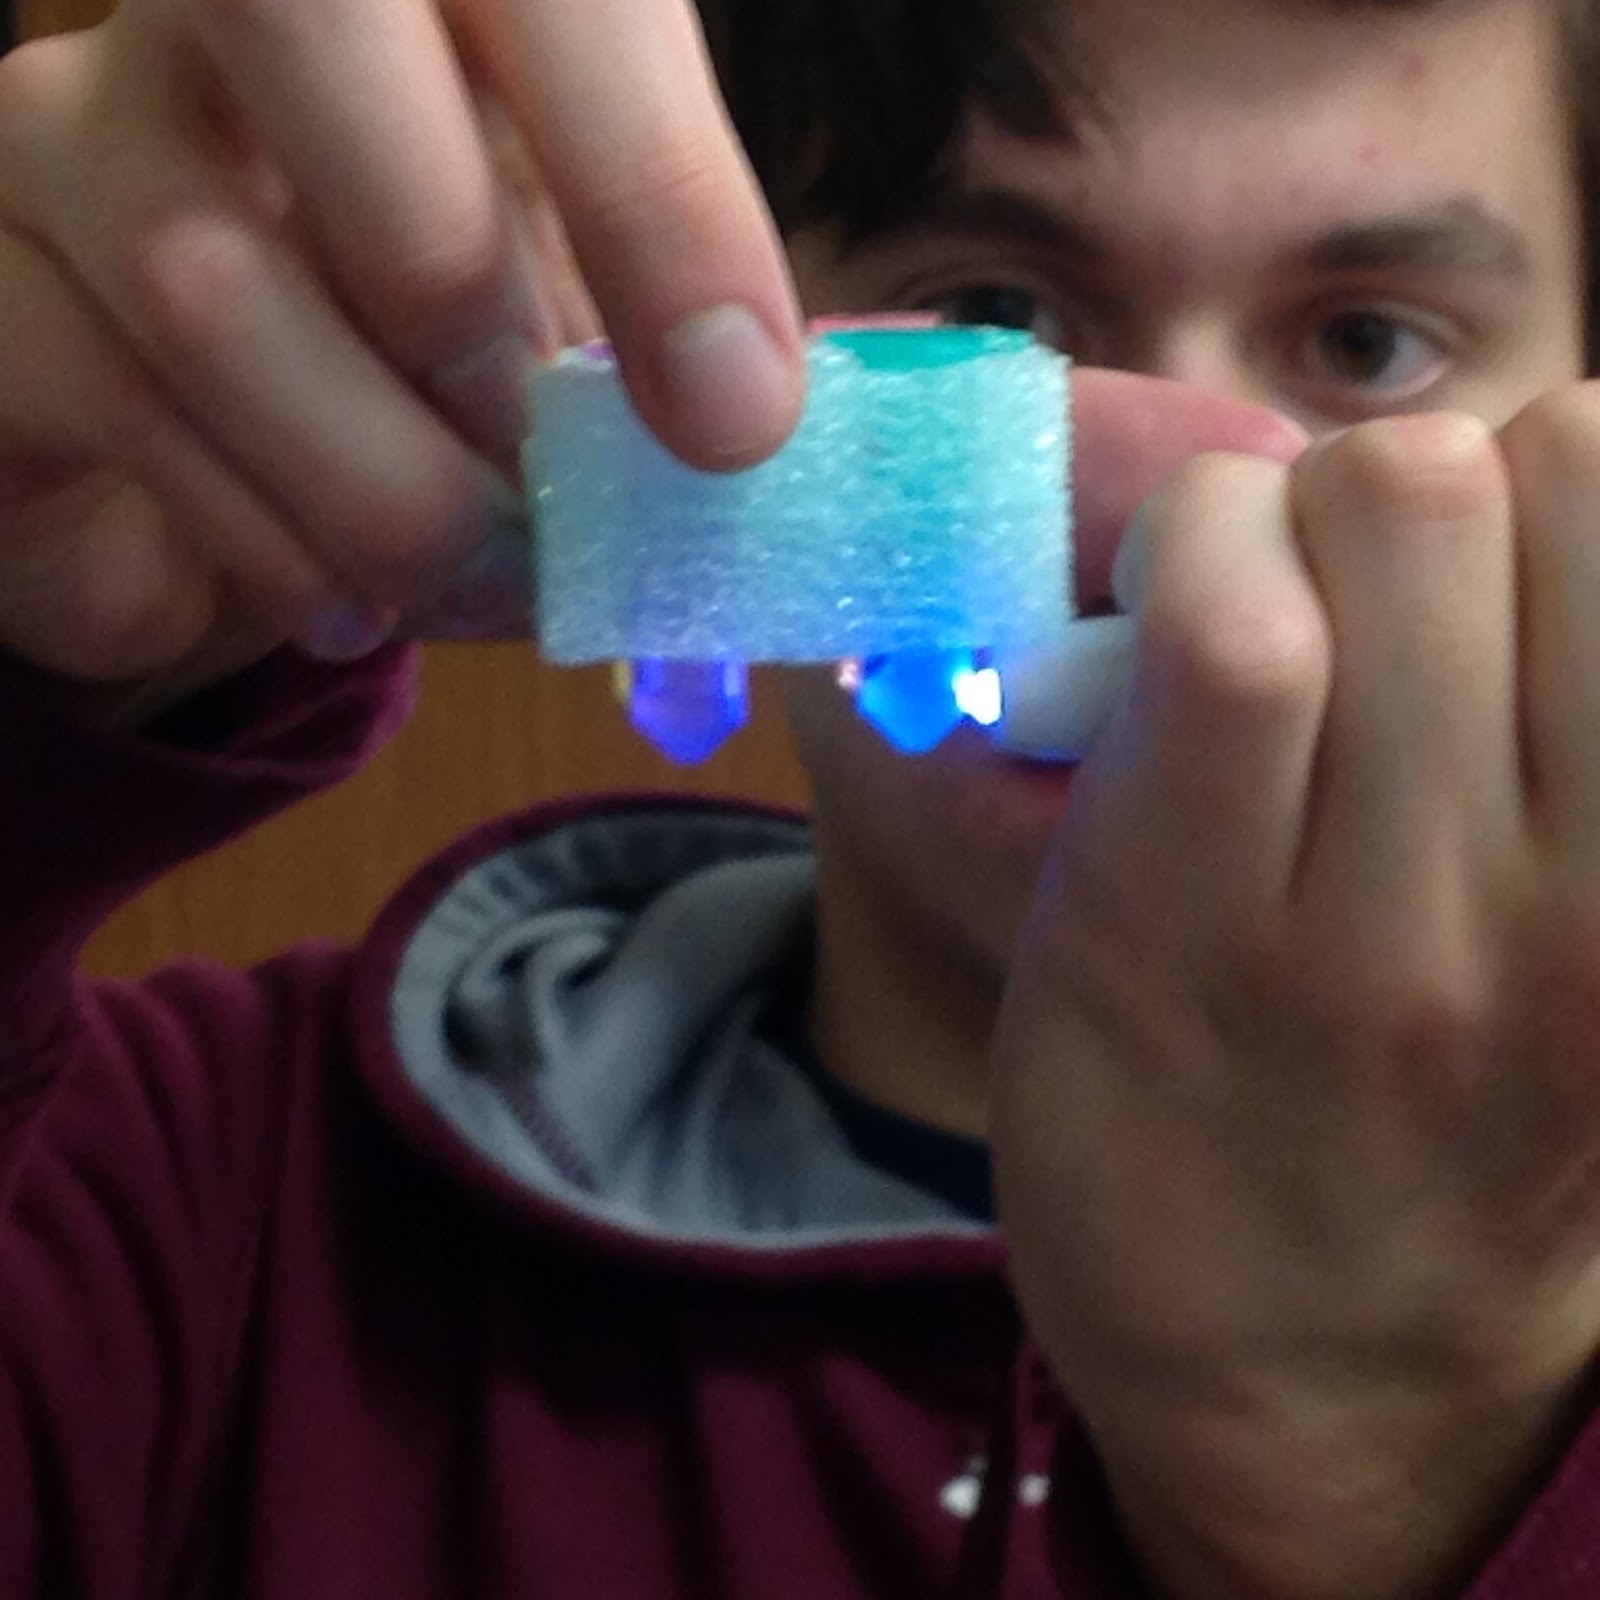
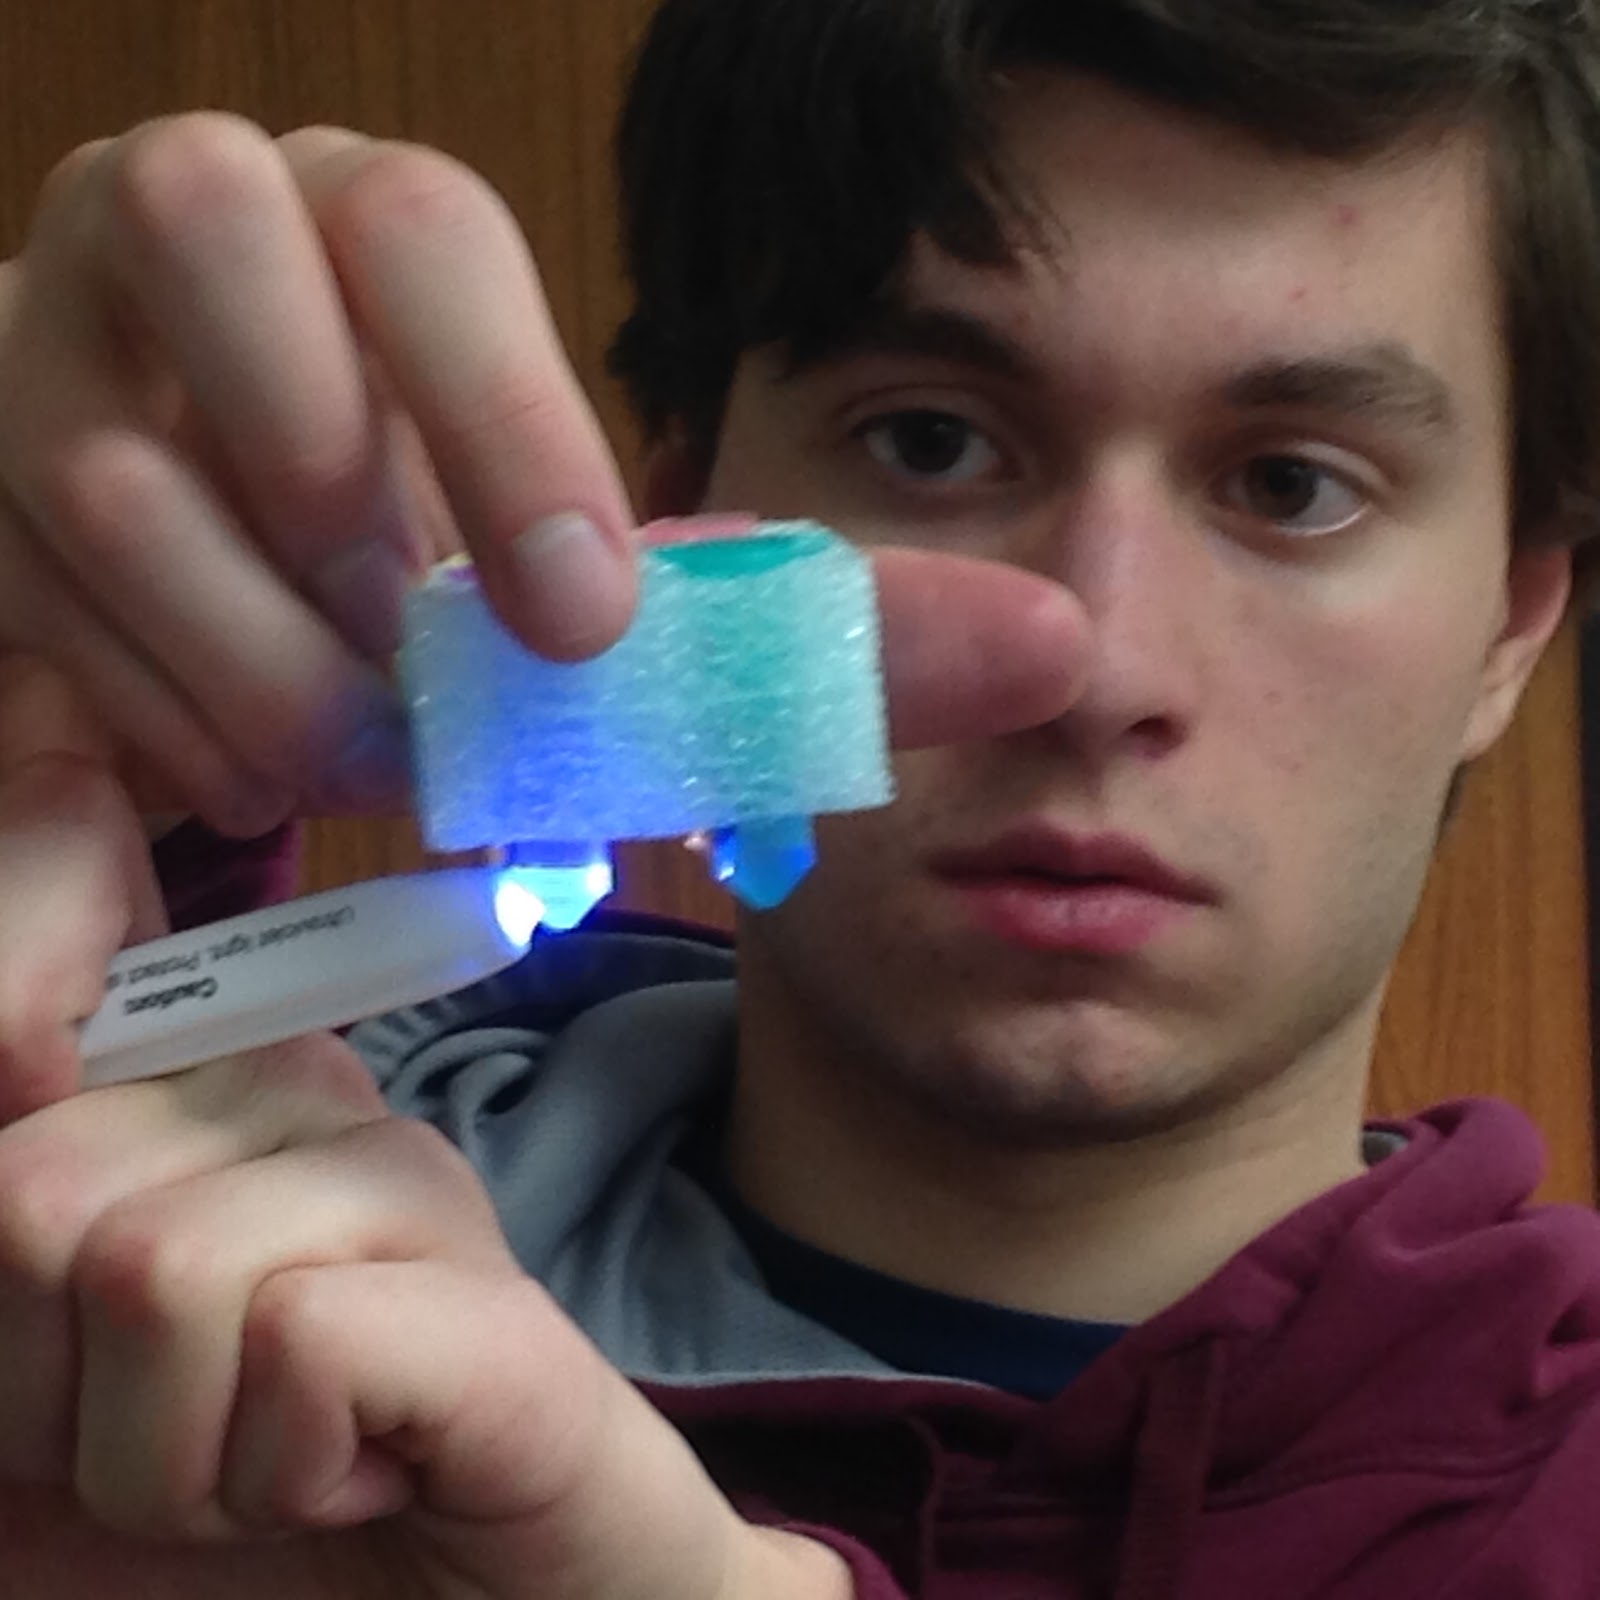
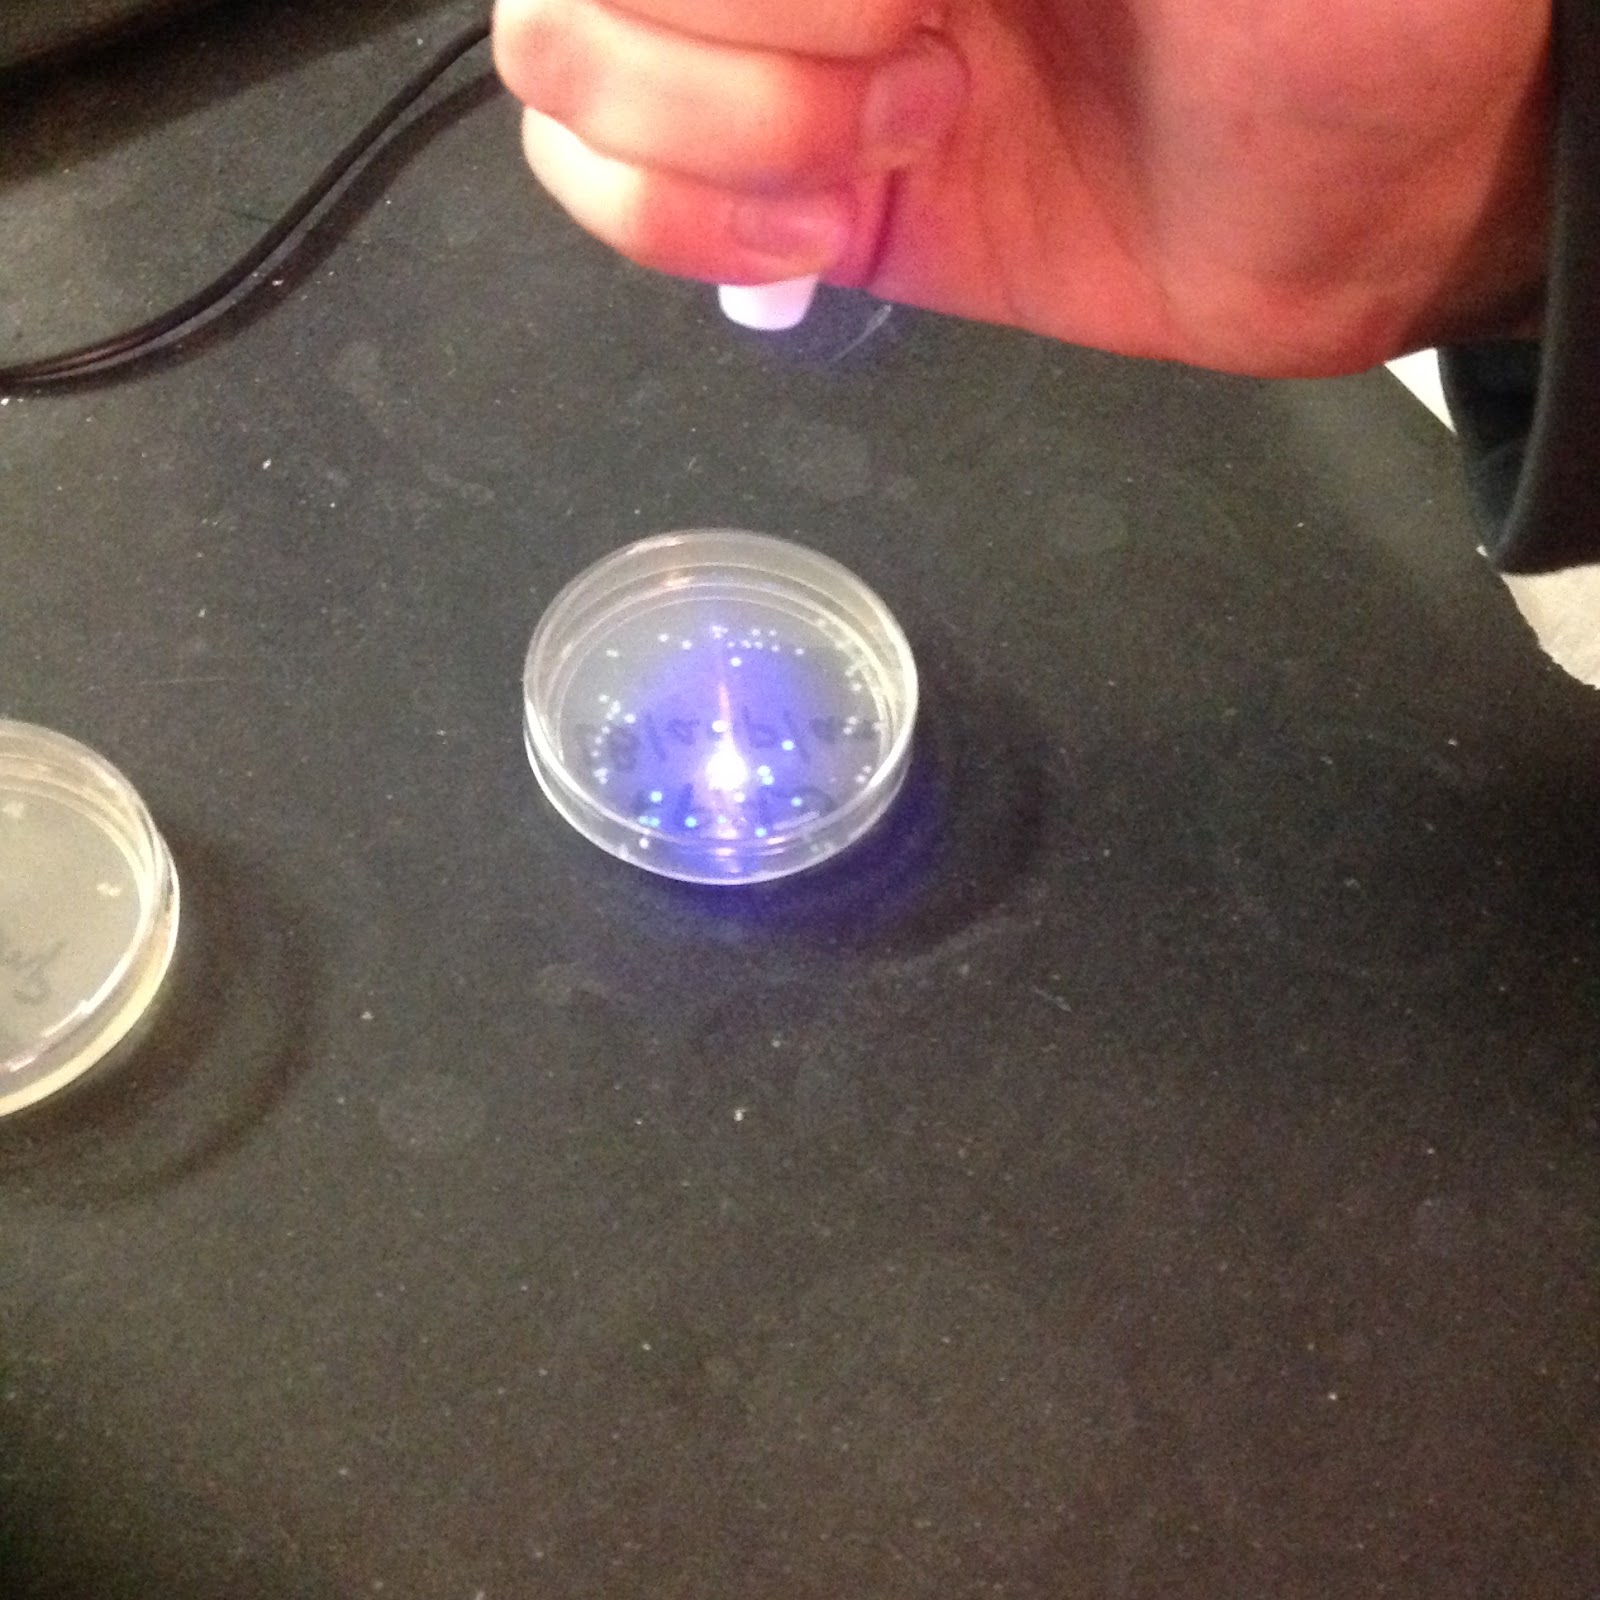
The next day, we reclaimed our cultures and opened them all up to examine them. While my groupmate responsible for the pictures did not include the first three plates, he did include the final one, being the +pGLO, LB/amp/ara plate. This culture managed to grow in spite of proximity to the ampicillin, which is normally an E. Coli killer. It also glows, too. Interesting!
Straight Outta Chipotle. Now with built-in rave lighting!
While we have no picture-proof for the other three cultures, I will describe them here. The -pGLO plate with only the LB was identical to the E. Coli culture we obtained the bacteria from the prior day, spread about the culture in many smears. The -pGLO plate with the ampicillin included had no growth, as the bacteria had no protection from the ampicillin and could not sustain itself. The +pGLO plate with the ampicillin did show growth, since the pGLO gene protects the bacteria from the antibiotic, but did not glow as no arabinose was available to allow the gene to function.

Once the lab was done, we killed all remaining E. Coli with bleach and disposed of all materials that the E. Coli inhabited. We wouldn’t want PHS to become the next Chipotle, now would we?

Data:
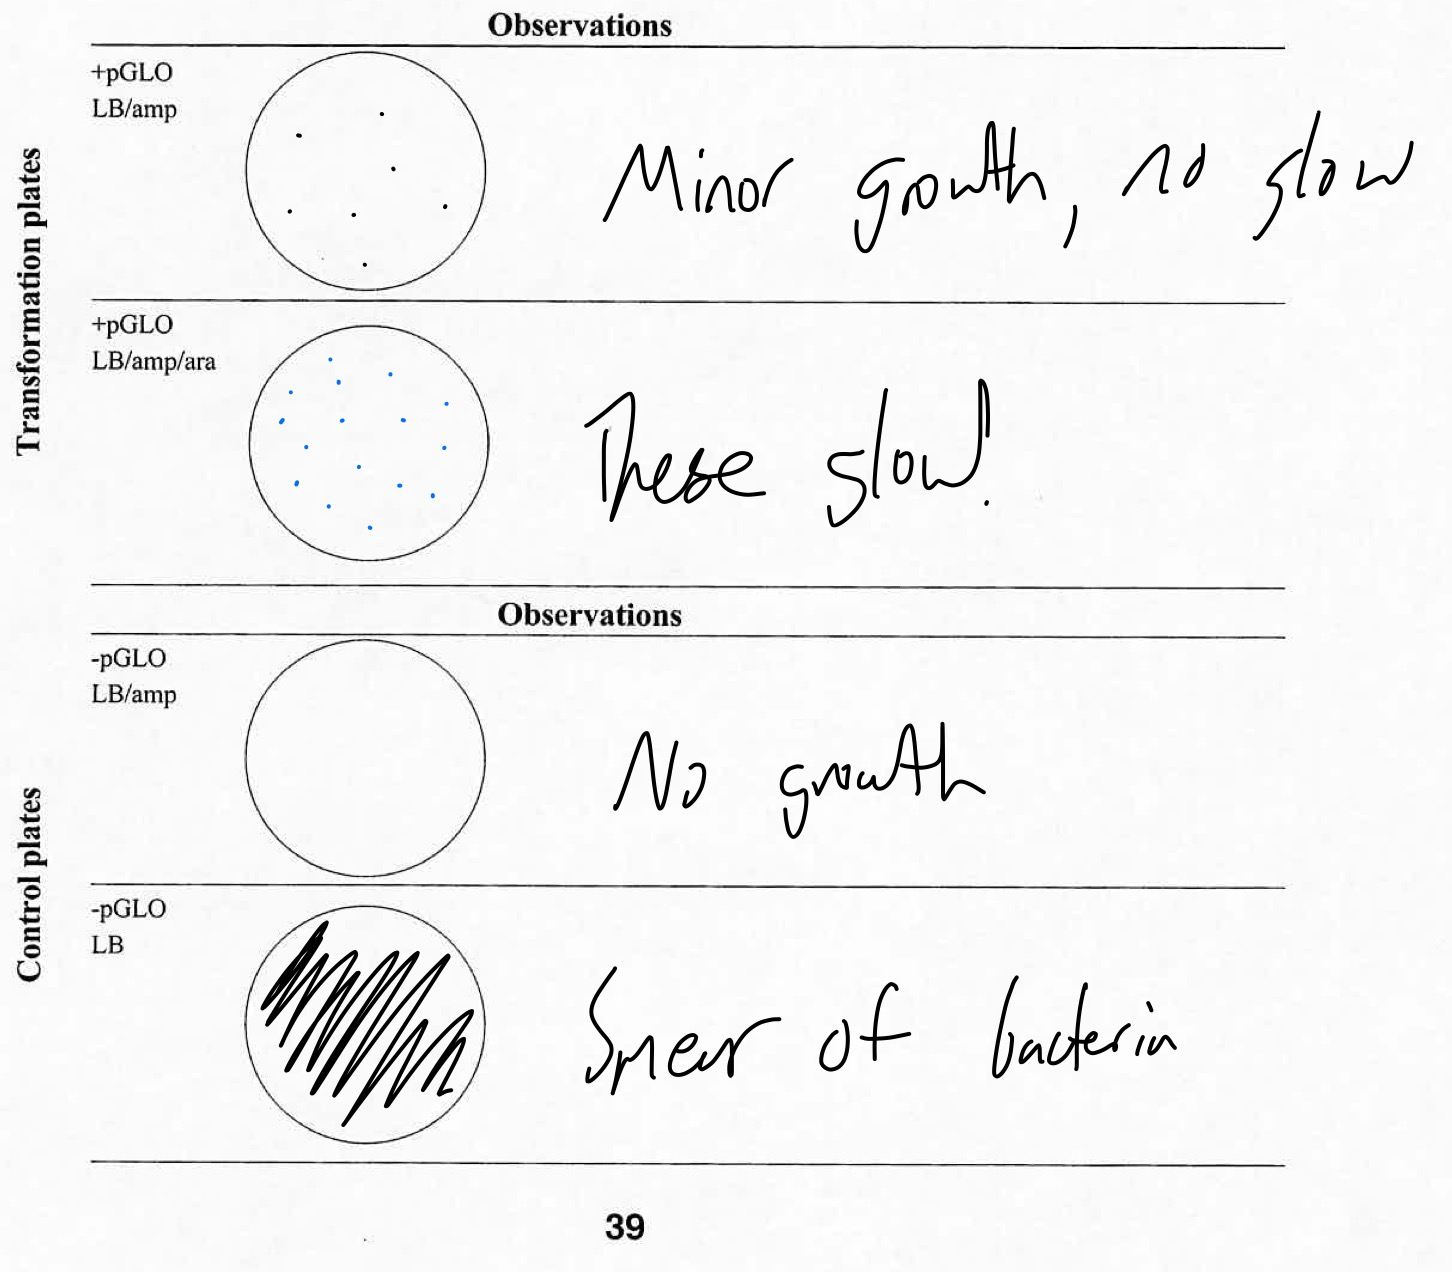
As stated in the purpose, the -pGLO plate with only the LB was identical to the E. Coli culture we obtained the bacteria from the prior day, spread about the culture in many smears. The -pGLO plate with the ampicillin included had no growth, as the bacteria had no protection from the ampicillin and could not sustain itself. The +pGLO plate with the ampicillin did show growth, since the pGLO gene protects the bacteria from the antibiotic, but did not glow as no arabinose was available to allow the gene to function. And the +pGLO plate with ampicillin and arabinose showed growth, thanks to the pGLO gene protecting the bacteria from the antibiotic, and was able to glow since arabinose was available for the gene to function.

Graphs and Charts:
pGLO plate observation chart

Discussion:
The E. Coli showed several changes when transformed by the pGLO plasmid DNA. The bacteria that incorporated the pGLO DNA into its own DNA was able to grow in conditions with ampicillin present, and glow under UV light. Bacteria without this gene had no natural fluorescence and could not survive in ampicillin-rich environments, as indicated by the above table.
The arabinose sugar plays a role in the ability for the pGLO’s glowing part of the gene to function. Without arabinose in the environment, it cannot naturally glow, as indicated by the +pGLO LB/amp plate.
We know for a fact that pGLO is responsible for these changes because the original bacteria did not glow naturally (as we determined during the procedure) and because E. Coli without the pGLO were not able to survive in ampicillin. And we know that this is not a naturally occurring trait within E. Coli because only the bacteria exposed to the plasmid were able to display these features, proving that transformation is required for such an effect to take place. We know that transformation definitely occurred in the +pGLO tube.
E. Coli was able to grow on the LB plate that did not contain any ampicillin or arabinose. Quite a lot, in fact! By looking at them, however, it is not fully determinable (though it is easy to hypothesize) whether or not the bacteria are ampicillin resistant. If we look at the plate that contained the ampicillin, we see no growth, and since both shared in the fact that they have no pGLO gene, it is easy to postulate that the bacteria on the LB only plate are not antibiotic resistant.
For the green glow to exist, arabinose must be present, UV light must be shining upon the cultures, and the pGLO gene must be incorporated into the cell’s DNA. Only the plate that was +pGLO and had arabinose available was able to grow, and it only glowed when exposed to UV light. UV light must be eliciting some sort of response within the bacteria cells, forcing the gene to activate and be transcribed to produce whatever chemical makes the cell grow. An advantage that turning genes on and off at will has is the ability for cells to only activate a vital gene when it is necessary. In the bacteria’s case, the bacteria only needs to glow its green color when UV light is present, and the cells capture and use the UV energy to glow without expending any of its own resources.

Conclusion:
Transformation is a vital aspect of genetics to understand because incorporating segments of DNA into other organisms, including humans, is extremely useful. If there is a deadly disease or mutation that can be mitigated through incorporating a certain segment of plasmid DNA, it is simple to do in the zygotic stage of an organism’s development. When the cell divides, so too does the gene, and it spreads throughout the whole of the body to better the organism’s life.

References:

  • Unless otherwise stated, all information related to transformation has been synthesized from Jane Reece’s Campbell Biology AP Edition Textbook and the pGLO Transformation Student Manual.
  • Paraphrased procedures have been synthesized from procedures found in the pGLO Transformation Student Manual.
  • The pGLO plate observation chart was lifted from the pGLO Transformation Student Manual, but all data is original to our experiences.
  • All pictures are original from the in-class experiment.

Wednesday, January 13, 2016

Meiosis/Mitosis Lab

Part A
Purpose:
This segment of the lab is designed to familiarize the experimenter with the concept of phases of cellular mitosis in both plant and animal cells, as wells as the duration that each lasts for. On the whitefish and root tip slides, all four phases of mitosis exist, in varying numbers. To determine which stages are longest, one needs only count the cells and identify the stages they are in. The more of that stage existing at one time on the slide, the longer the stage.


Introduction:
Mitosis is the process that cells go through in order to divide. There are four encompassing terms to divide this process into easy to understand steps. The first is prophase, the point in time where chromatin condenses into chromosomes in order to facilitate the dividing process and equally split genetic information amongst daughter cells. At this point in time, the cell is undergoing basic changes to prepare itself for division. The second is metaphase, the point in time at which the cells’ chromosomes align in the center and attach to the spindle from their centromere. At this stage, the cell is preparing to divide and is separating the chromosomes as such. The third is anaphase, where the chromatid pairs separate and walk along spindle fibers towards opposite sides of the cell. At this point in time, the cell is almost ready to divide since the genetic information is (usually) evenly distributed. The final phase is telophase, where a new nuclear envelope envelopes the chromosomes, marking the beginning of nucleus formation. After which, the process of cytokinesis splits the cell in two and creates two identical daughter cells. In plant cells, a new cell wall is formed in between the new cells rather than the animal cell’s cleavage furrow process.


Methods:
Two partially separate, but equally interconnected tests were undertaken in order to quantify the length of time cells spend in each stage of mitosis. The first step was actually discovering which cells were in which stage. Using a microscope on the 10x objective setting, a location on both the whitefish and root tip was focused on, and the 40x setting was used to study individual cells. From this process, and prior knowledge, how each cell looked in each stage was made apparent.
Interphase
Whitefish
This example boasts an intact nuclear envelope, which allows us to infer that cell is not ready to divide and is in the process of duplicating genetic information, organelles, and growing in size.


Prophase
Root Tip


This image shows that chromosomes have begun to form in this phase, but are unorganized.


Metaphase
Root Tip


Whitefish
These two images show how chromosomes begin to line up along the center of the cell during this phase.


Anaphase
Root Tip


Whitefish
These two examples (pardon the image scaling on the whitefish) demonstrate how chromosomes walk along their spindle fibers during this phase.


Telophase
Root Tip


Whitefish
These two examples show how the cell splits in two during this phase to create two identical daughter cells.


With this knowledge in hand, we were able to quantify how many cells were in each particular stage of mitosis by using an extraordinarily simple process: counting! If the cell appeared to look like the example, it was tallied under the category related to the specific stage of mitosis. This counting process took place on three different fields, and the total number of cells and what stages they were in were counted for each. Once that data was retrieved, the total number of cells in each stage was added together, and the percentages were calculated based against the total number of cells. Afterwards, this percentage was multiplied by 1440 minutes in order to generate the time a standard cell spent in that particular stage. The results from this can be viewed in the below table.


Data:
This chart organizes the data collected in the latter part of the procedure.

Graphs and Charts:
No graphs were made in this particular experiment.


Discussion:
During interphase, the cell is preparing to divide. It does this by growing much larger, duplicating its genetic information (evident by the fact that there are two sets of chromosomes) and duplicating its organelles in order to facilitate proper growth and function of the daughters. When the cell duplicates, it has all the basic properties it needs to survive. All it needs to do is grow and duplicate its own genetic information and organelles so it, too, can divide.
In plant cells, mitosis works nearly identically to animal cells. However, instead of pinching apart, a new cell wall is formed to separate the daughter cells. This is because the plant’s cell wall is not a flexible membrane, and does not allow the cell to pinch apart. This rigid structure is what gives plants their characteristic rigid appearance.
Centrosomes are parts of the nuclear membrane that break off during prophase and form the mitotic spindle, which allows the chromosomes to walk across to opposite sides of the cell during later phases. If these centrosomes did not exist, cellular division could not occur since chromosomes would be unable to migrate themselves to the future daughter cells.
In regards to the specific root tip we observed, it was actively dividing. Many cells were in the mitosis stage, but in separate phases. If this locale was not actively dividing, even more cells than there currently are would be in interphase instead.Since mitosis only lasts a few hours whereas interphase can last around 18-20, the number of cells in a specific mitosis stage would be drastically reduced to a number even smaller than this experiment boasts now.
In regards to the table, we can assume that cells spend the most time in interphase. This makes sense, as the cell needs a lot of time to literally duplicate its interior components, like organelles and genetic information, as well as growing to a size that would be able to produce daughter cells large enough to sustain themselves. The next stages are tied between prophase and telophase. The former condenses chromatin into chromosomes, which then migrate to more organized formations in later stages, whereas the latter splits the cell in two after forming a nuclear envelope around the chromosomes. This can lead us to believe that the formation or degradation of chromosomes into or from chromatin is a time-consuming process. Considering that the matter is essentially changing states from a viscous liquid to a more solid counterpart, this change makes sense. Metaphase is third longest, which entails the process of organizing chromosomes at the center of the cell and attaching them to spindle fibers. From this, we can infer that this organization is a time-consuming process, most likely to ensure that DNA is separated equally in the following phase to prevent a cell from having an improper amount of chromosomes. And the shortest stage is anaphase, which is solely the process in which the chromosomes walk along the spindle fibers. This is the only event that happens in this stage, making it understandable why it takes the least amount of time.


Conclusion:
This portion of the lab was designed to ensure that the experimenter understands why mitosis and interphase take the amount of time that they do. Interphase is the longest because the formation, duplication, and growth of important cellular features are vital to the state of the cell post-division. Mitosis is comparatively shorter, but the stages it is divided into are all unique and paramount to the formation of a functioning cell. If anything goes wrong, a cell can mutate. It could be a lack of a certain chromosome or organelle, but many mutations are a detriment to the organism as a whole. Cancerous cells grow without regulation, forming tumors that can kill organisms quickly if they spread. Certain mutation in gametes (it’s meiosis, but the same idea applies) can cause mental conditions that stunt the ability for an organism to function. In short, each stage of the mitosis process is important and paramount to the organism’s survival.


References:
  • Unless otherwise stated, all information related to mitosis has been synthesized from Jane Reece’s Campbell Biology AP Edition Textbook and Collegeboard’s Lab Three: Mitosis and Meiosis.
  • Tables 3.1’s outline has been taken from Collegeboard’s Lab Lab Three: Mitosis and Meiosis, but the information is original to the experiment.
  • Paraphrased procedures have been synthesized from procedures found in Collegeboard’s Lab Three: Mitosis and Meiosis
  • All pictures are original from the in-class experiment.


Part B
Purpose: In this lab we wanted to show the different stages of meiosis using chromosome models. The models were a representation of a chromosome going through both Meiosis I and Meiosis II. Nonetheless, it was used to show how crossing over occurs in genes.
We used these models to observe meiosis I and meiosis II at the chromosomal level at a size that was easier to understand.


Introduction:
Meiosis produces four unique haploid cells unlike mitosis which produces two identical diploid cells. In Meiosis I, the chromosome number changes from diploid to haploid. Moreover, in Meiosis II, the sister chromatids are separated which creates four haploid cells. Crossing over increases genetic diversity it occurs when two different chromosomes exchange their genetic material. The distance between two chromatids determines how much crossing over occurs. Having more space allows crossing over to occur more frequently .


Methods:


Interphase - in Interphase, chromosomes start as single chromatin strands that are not organized. Then, DNA synthesis occurs, joining the single strand to a sister chromatid at the centromere. This creates a chromosome.


Prophase I - In this phase, the two homologous chromosomes pair up to exchange genetic information via crossing over as well as form a tetrad. This is different than prophase in mitosis where the nuclear envelope begins to disintegrate. The crossing over of chromosomes that is shown is the primary reason for genetic variation among species.
metaphase I - The newly formed tetrad said move to the center of the cell, between the two poles along the “metaphase plate”. In Metaphase I, the spindle fibers attach the centromeres of each chromosome. Unlike Metaphase in Mitosis, the kinetochores of the sister chromatids face the same pole.
Anaphase I - in this phase, the homologous chromosomes are separated and pulled to opposite poles along the spindle fibers. This differs from mitosis, where the sister chromatids are torn apart at the centromere and pulled to opposite poles.
Telophase I - In this phase, a nuclear envelope forms, as well as a cleavage furrow. Then, two haploid cells are produced, both with chromosomes that still have both sister chromatids.


Prophase II - In this phase, we start off with the two haploid cells we left off with in telophase I. In oogenesis and spermatogenesis, these cells are the secondary oocytes and spermatocytes respectively. The nuclear envelope begins to break down and the centromeres move towards the poles.


Metaphase II - Again, the chromosomes line up in the middle of their respective cells along the metaphase plate. Then, similar to mitosis, the spindle attaches the kinetochores of each centromere to the opposite poles. This results in the separation of sister chromatids later on in Anaphase II.
Anaphase II - the sister chromatids are pulled apart by the spindle fibers towards opposite poles of each cell. They are now chromosomes. The cells begin to elongate in preparation for cytokinesis to occur.


Telophase II - The final phase of meiosis, the chromosomes arrive at opposite sides of the cell. Cytokinesis occurs, forming genetically varying haploid cells. In oogenesis, one of these cells is a mature ovum, while the rest are polar bodies to be reabsorbed by the body. In spermatogenesis, all four haploid cells are spermatocytes to be used in sexual reproduction.


Data:


Discussion:
There are many stages of meiosis I and meiosis II. In the first stage of meiosis I, interphase I, chromatin is found coiled inside the nuclear envelope. Karyokinesis, the division of the nucleus of a cell is a process that occurs during interphase I. The nucleus must divide before the cell can divide. The centrosomes that are located within the plasma membrane are in close contact and yet they do not form spindles. In the next stage, prophase I, spindles begin to be formed within the plasma membrane. In metaphase I the centrosomes begin to line up where they attach to the kinetochores. The mitotic spindle continues to enlarge during this phase of meiosis I. In meiosis I a cell is able to divide into two diploid cells; however, in meiosis II those two diploid cells divide into four haploid cells. Meiosis plays a crucial role in sexual reproduction because it produces haploid sex cells which contain the right amount of chromosomes. Through meiosis greater genetic diversity is achieved which is beneficial because it gives organisms a greater chance to survive.  


Conclusion: From our data we found that mitosis and meiosis have very different end results. For example, in meiosis the number of chromosomes are cut in half and four daughter cells are produced. Mitosis on the other hand produces two identical cells. We observed that meiosis I differs from mitosis in almost every phase, most noticeably in anaphase I and telophase I where the homologs are separated (As opposed to sister chromatids in mitosis) and the resulting cells are haploid (As opposed to Diploid in mitosis). Then, we were able to observe the similarities between meiosis II and mitosis, with the only major differences being that the cells in meiosis II are haploid and the resulting number of cells is four. Meiosis II acts out very similar to Mitosis, with spindle fibers of opposite poles attaching to kinetochores in Metaphase II, and the resulting separation of sister chromatids in Anaphase II causes there to be 4 gametes created after telophase II because the chromosomes from each cell are still attached to their sister chromatids.