Wednesday, January 13, 2016

Meiosis/Mitosis Lab

Part A
Purpose:
This segment of the lab is designed to familiarize the experimenter with the concept of phases of cellular mitosis in both plant and animal cells, as wells as the duration that each lasts for. On the whitefish and root tip slides, all four phases of mitosis exist, in varying numbers. To determine which stages are longest, one needs only count the cells and identify the stages they are in. The more of that stage existing at one time on the slide, the longer the stage.


Introduction:
Mitosis is the process that cells go through in order to divide. There are four encompassing terms to divide this process into easy to understand steps. The first is prophase, the point in time where chromatin condenses into chromosomes in order to facilitate the dividing process and equally split genetic information amongst daughter cells. At this point in time, the cell is undergoing basic changes to prepare itself for division. The second is metaphase, the point in time at which the cells’ chromosomes align in the center and attach to the spindle from their centromere. At this stage, the cell is preparing to divide and is separating the chromosomes as such. The third is anaphase, where the chromatid pairs separate and walk along spindle fibers towards opposite sides of the cell. At this point in time, the cell is almost ready to divide since the genetic information is (usually) evenly distributed. The final phase is telophase, where a new nuclear envelope envelopes the chromosomes, marking the beginning of nucleus formation. After which, the process of cytokinesis splits the cell in two and creates two identical daughter cells. In plant cells, a new cell wall is formed in between the new cells rather than the animal cell’s cleavage furrow process.


Methods:
Two partially separate, but equally interconnected tests were undertaken in order to quantify the length of time cells spend in each stage of mitosis. The first step was actually discovering which cells were in which stage. Using a microscope on the 10x objective setting, a location on both the whitefish and root tip was focused on, and the 40x setting was used to study individual cells. From this process, and prior knowledge, how each cell looked in each stage was made apparent.
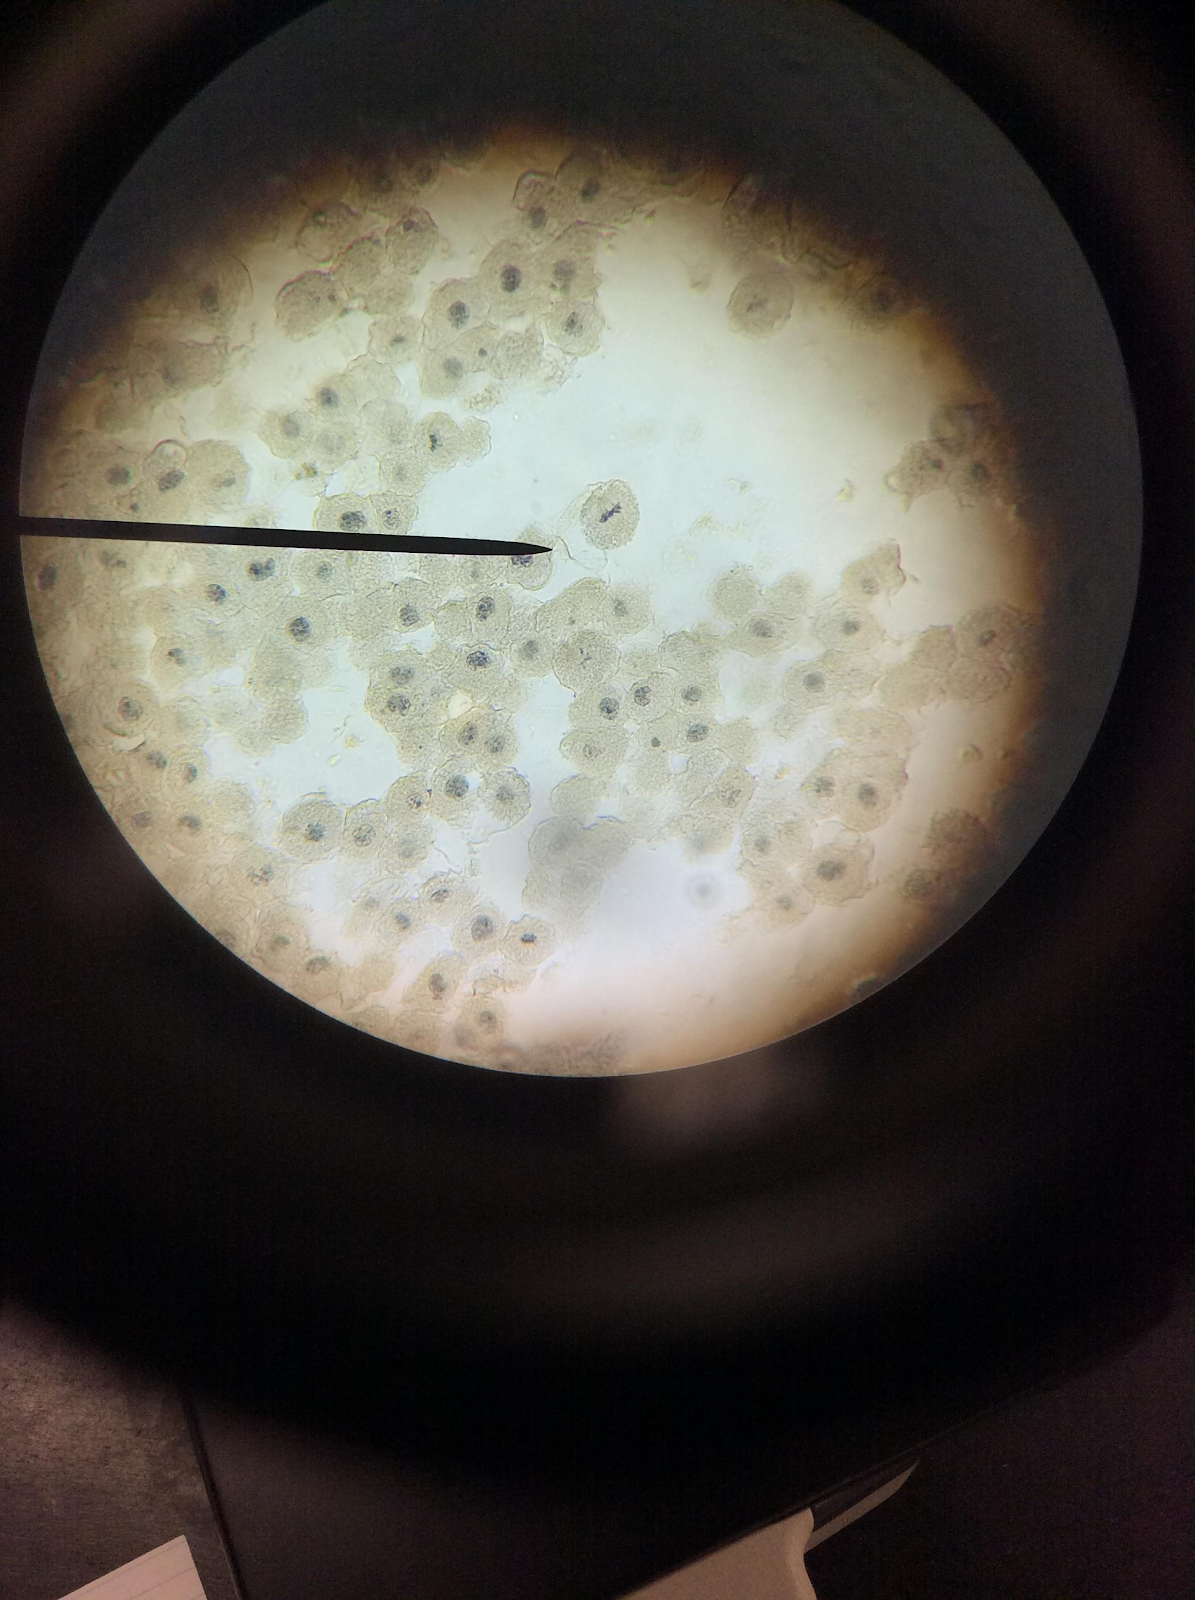
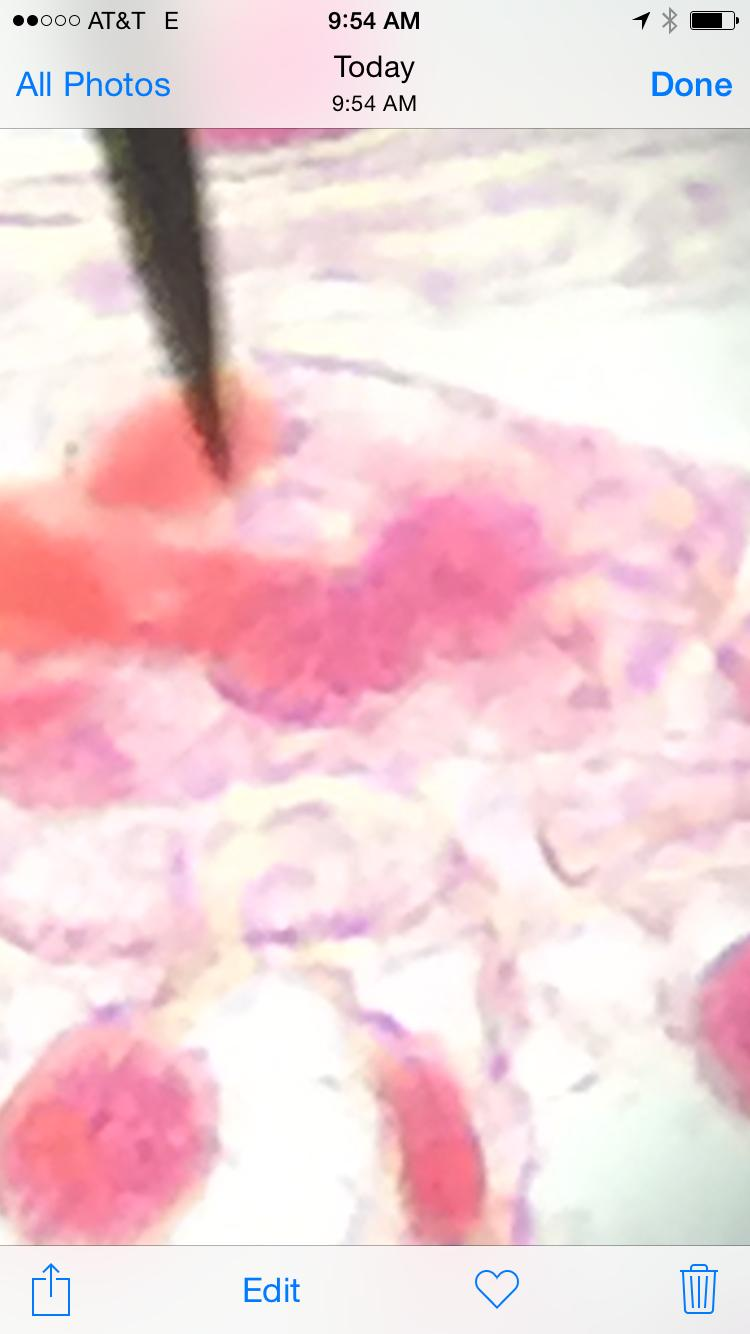
Interphase
Whitefish
This example boasts an intact nuclear envelope, which allows us to infer that cell is not ready to divide and is in the process of duplicating genetic information, organelles, and growing in size.
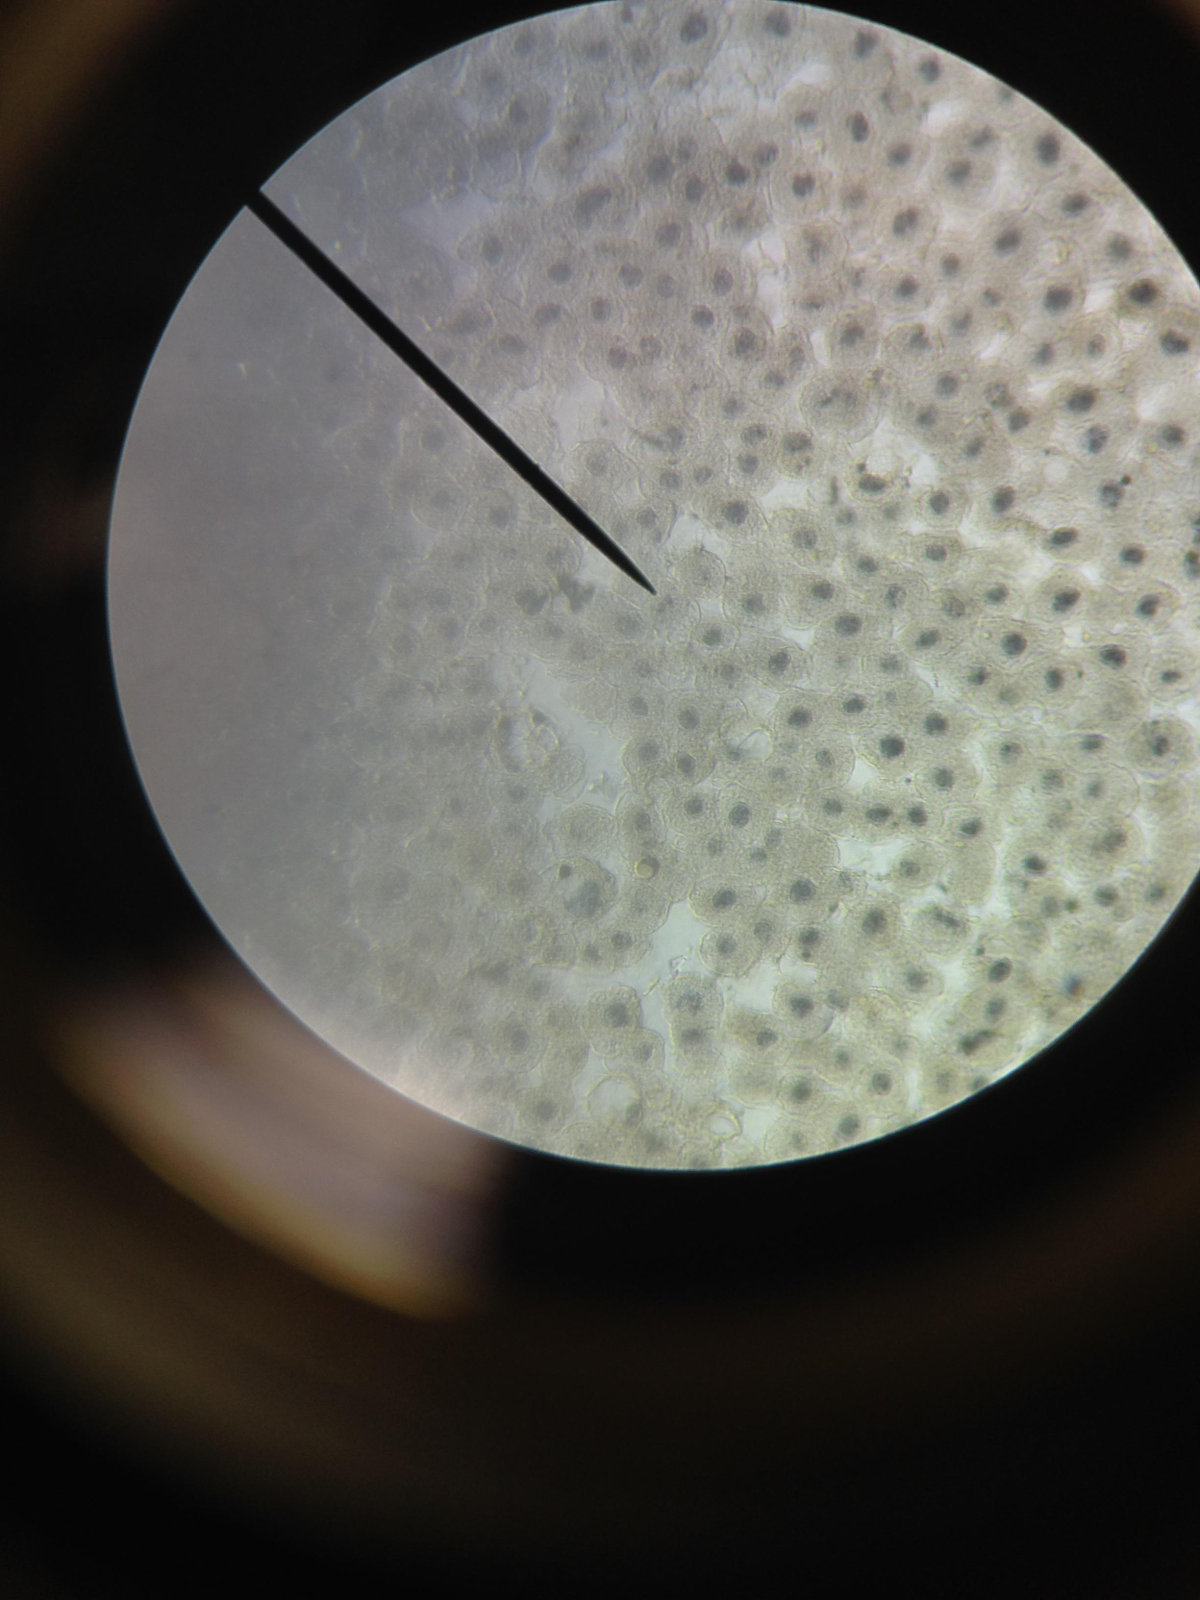

Prophase
Root Tip


This image shows that chromosomes have begun to form in this phase, but are unorganized.
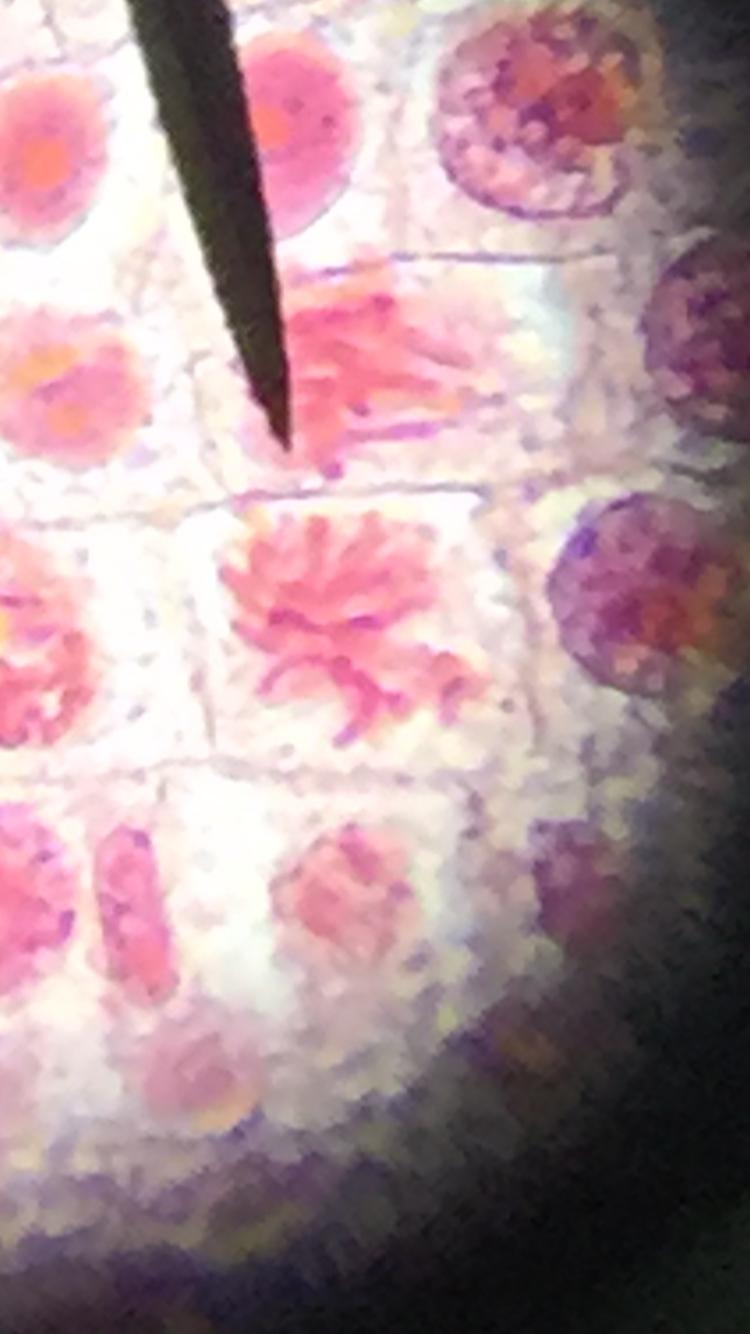

Metaphase
Root Tip


Whitefish
These two images show how chromosomes begin to line up along the center of the cell during this phase.


Anaphase
Root Tip


Whitefish
These two examples (pardon the image scaling on the whitefish) demonstrate how chromosomes walk along their spindle fibers during this phase.


Telophase
Root Tip


Whitefish
These two examples show how the cell splits in two during this phase to create two identical daughter cells.


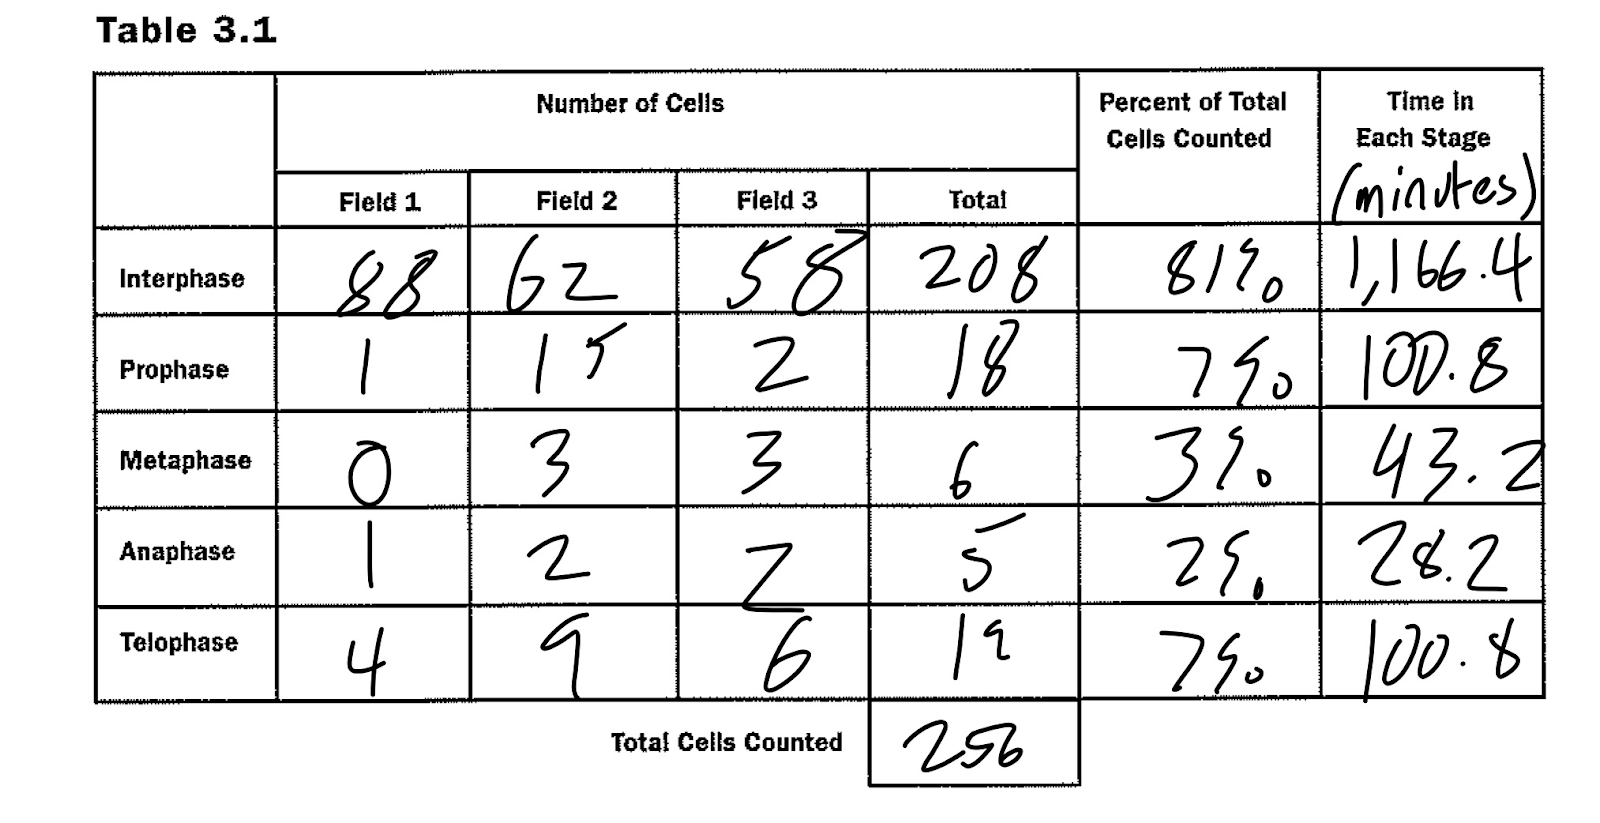
With this knowledge in hand, we were able to quantify how many cells were in each particular stage of mitosis by using an extraordinarily simple process: counting! If the cell appeared to look like the example, it was tallied under the category related to the specific stage of mitosis. This counting process took place on three different fields, and the total number of cells and what stages they were in were counted for each. Once that data was retrieved, the total number of cells in each stage was added together, and the percentages were calculated based against the total number of cells. Afterwards, this percentage was multiplied by 1440 minutes in order to generate the time a standard cell spent in that particular stage. The results from this can be viewed in the below table.


Data:
This chart organizes the data collected in the latter part of the procedure.

Graphs and Charts:
No graphs were made in this particular experiment.


Discussion:
During interphase, the cell is preparing to divide. It does this by growing much larger, duplicating its genetic information (evident by the fact that there are two sets of chromosomes) and duplicating its organelles in order to facilitate proper growth and function of the daughters. When the cell duplicates, it has all the basic properties it needs to survive. All it needs to do is grow and duplicate its own genetic information and organelles so it, too, can divide.
In plant cells, mitosis works nearly identically to animal cells. However, instead of pinching apart, a new cell wall is formed to separate the daughter cells. This is because the plant’s cell wall is not a flexible membrane, and does not allow the cell to pinch apart. This rigid structure is what gives plants their characteristic rigid appearance.
Centrosomes are parts of the nuclear membrane that break off during prophase and form the mitotic spindle, which allows the chromosomes to walk across to opposite sides of the cell during later phases. If these centrosomes did not exist, cellular division could not occur since chromosomes would be unable to migrate themselves to the future daughter cells.
In regards to the specific root tip we observed, it was actively dividing. Many cells were in the mitosis stage, but in separate phases. If this locale was not actively dividing, even more cells than there currently are would be in interphase instead.Since mitosis only lasts a few hours whereas interphase can last around 18-20, the number of cells in a specific mitosis stage would be drastically reduced to a number even smaller than this experiment boasts now.
In regards to the table, we can assume that cells spend the most time in interphase. This makes sense, as the cell needs a lot of time to literally duplicate its interior components, like organelles and genetic information, as well as growing to a size that would be able to produce daughter cells large enough to sustain themselves. The next stages are tied between prophase and telophase. The former condenses chromatin into chromosomes, which then migrate to more organized formations in later stages, whereas the latter splits the cell in two after forming a nuclear envelope around the chromosomes. This can lead us to believe that the formation or degradation of chromosomes into or from chromatin is a time-consuming process. Considering that the matter is essentially changing states from a viscous liquid to a more solid counterpart, this change makes sense. Metaphase is third longest, which entails the process of organizing chromosomes at the center of the cell and attaching them to spindle fibers. From this, we can infer that this organization is a time-consuming process, most likely to ensure that DNA is separated equally in the following phase to prevent a cell from having an improper amount of chromosomes. And the shortest stage is anaphase, which is solely the process in which the chromosomes walk along the spindle fibers. This is the only event that happens in this stage, making it understandable why it takes the least amount of time.


Conclusion:
This portion of the lab was designed to ensure that the experimenter understands why mitosis and interphase take the amount of time that they do. Interphase is the longest because the formation, duplication, and growth of important cellular features are vital to the state of the cell post-division. Mitosis is comparatively shorter, but the stages it is divided into are all unique and paramount to the formation of a functioning cell. If anything goes wrong, a cell can mutate. It could be a lack of a certain chromosome or organelle, but many mutations are a detriment to the organism as a whole. Cancerous cells grow without regulation, forming tumors that can kill organisms quickly if they spread. Certain mutation in gametes (it’s meiosis, but the same idea applies) can cause mental conditions that stunt the ability for an organism to function. In short, each stage of the mitosis process is important and paramount to the organism’s survival.


References:
  • Unless otherwise stated, all information related to mitosis has been synthesized from Jane Reece’s Campbell Biology AP Edition Textbook and Collegeboard’s Lab Three: Mitosis and Meiosis.
  • Tables 3.1’s outline has been taken from Collegeboard’s Lab Lab Three: Mitosis and Meiosis, but the information is original to the experiment.
  • Paraphrased procedures have been synthesized from procedures found in Collegeboard’s Lab Three: Mitosis and Meiosis
  • All pictures are original from the in-class experiment.


Part B
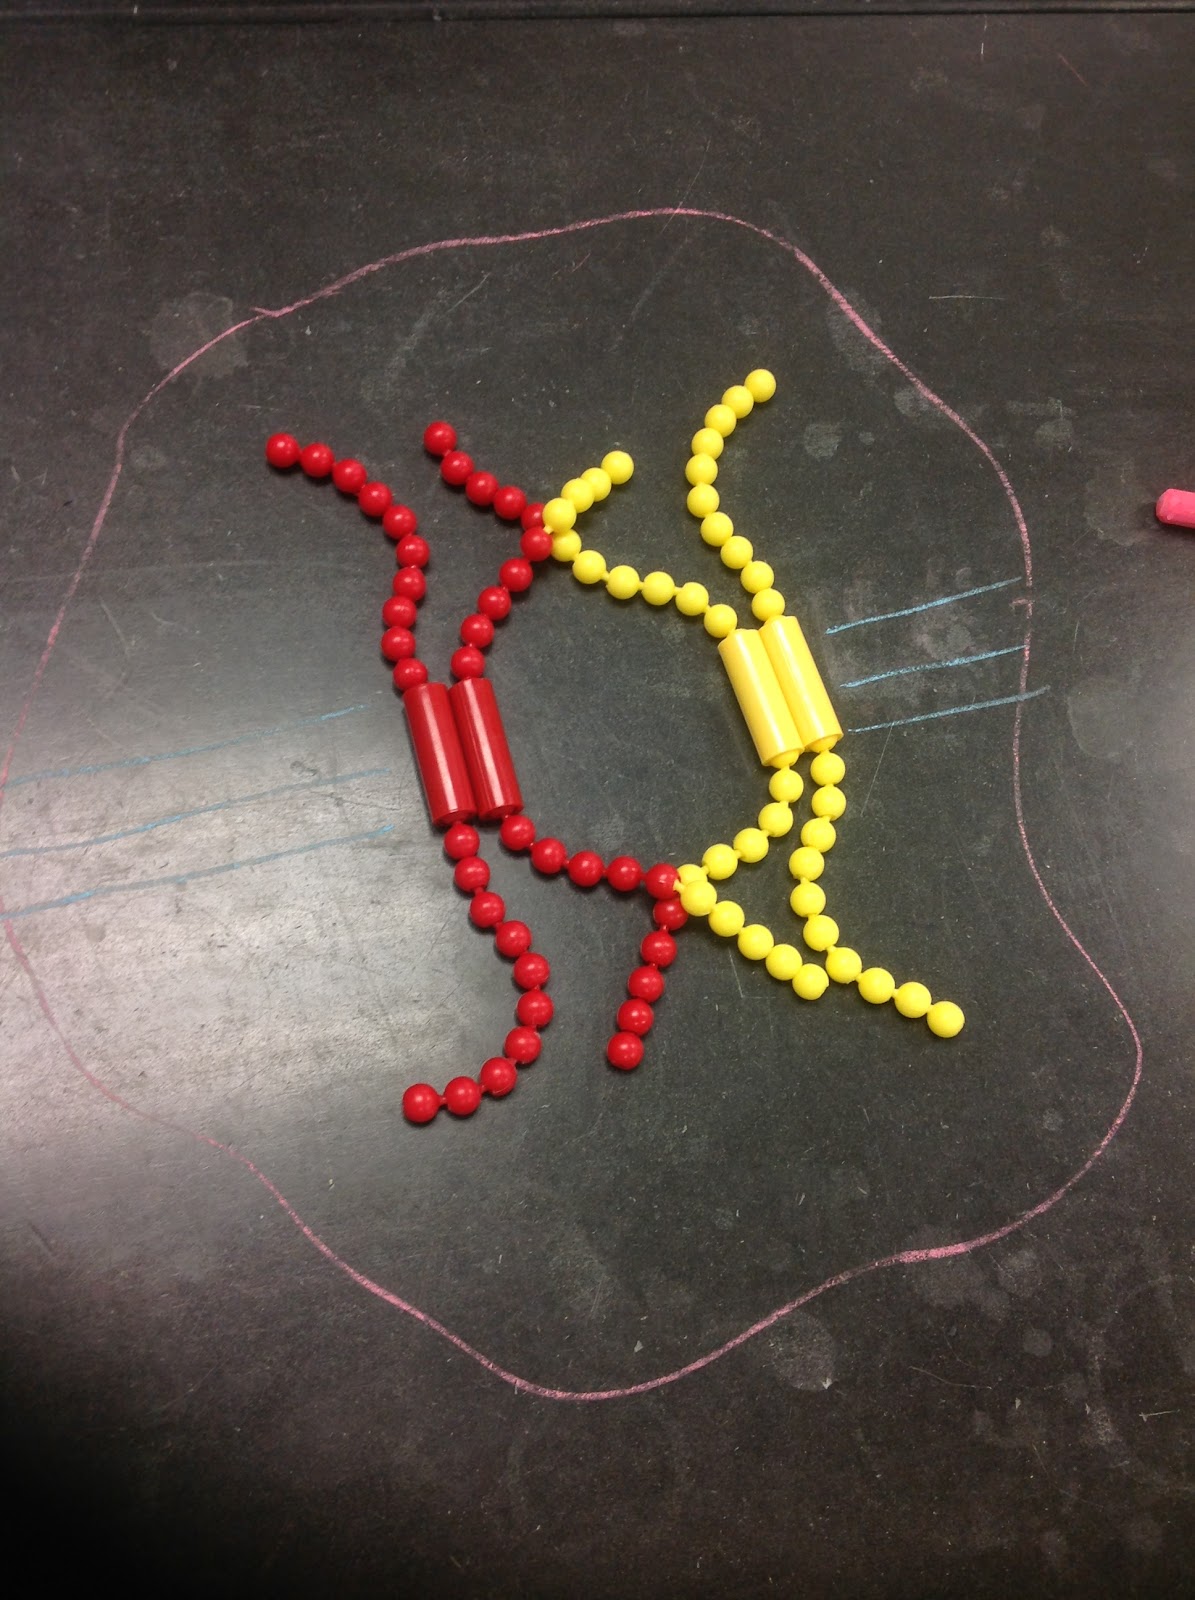
Purpose: In this lab we wanted to show the different stages of meiosis using chromosome models. The models were a representation of a chromosome going through both Meiosis I and Meiosis II. Nonetheless, it was used to show how crossing over occurs in genes.
We used these models to observe meiosis I and meiosis II at the chromosomal level at a size that was easier to understand.


Introduction:
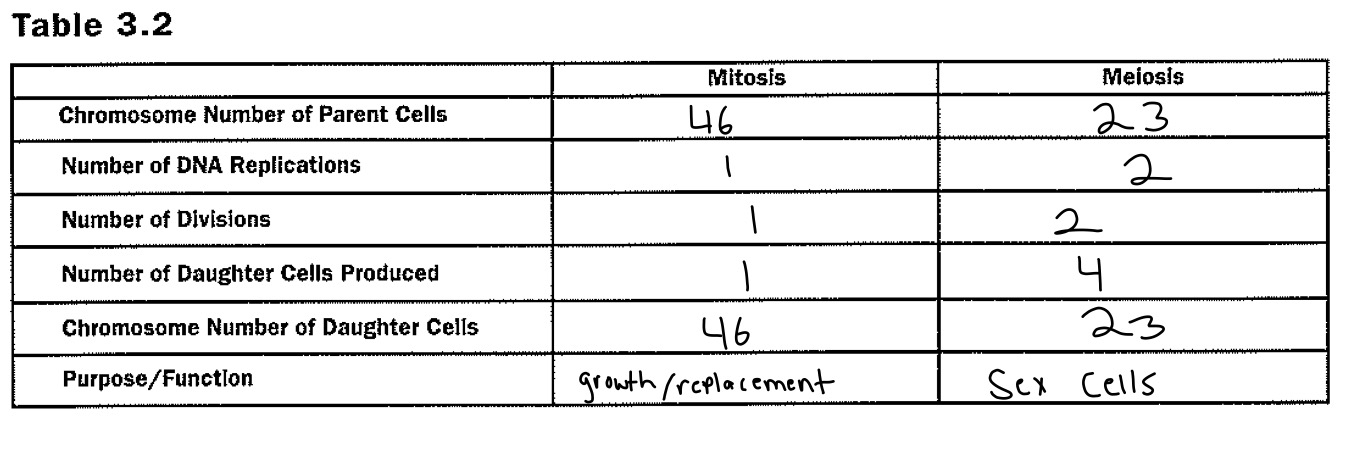
Meiosis produces four unique haploid cells unlike mitosis which produces two identical diploid cells. In Meiosis I, the chromosome number changes from diploid to haploid. Moreover, in Meiosis II, the sister chromatids are separated which creates four haploid cells. Crossing over increases genetic diversity it occurs when two different chromosomes exchange their genetic material. The distance between two chromatids determines how much crossing over occurs. Having more space allows crossing over to occur more frequently .


Methods:


Interphase - in Interphase, chromosomes start as single chromatin strands that are not organized. Then, DNA synthesis occurs, joining the single strand to a sister chromatid at the centromere. This creates a chromosome.


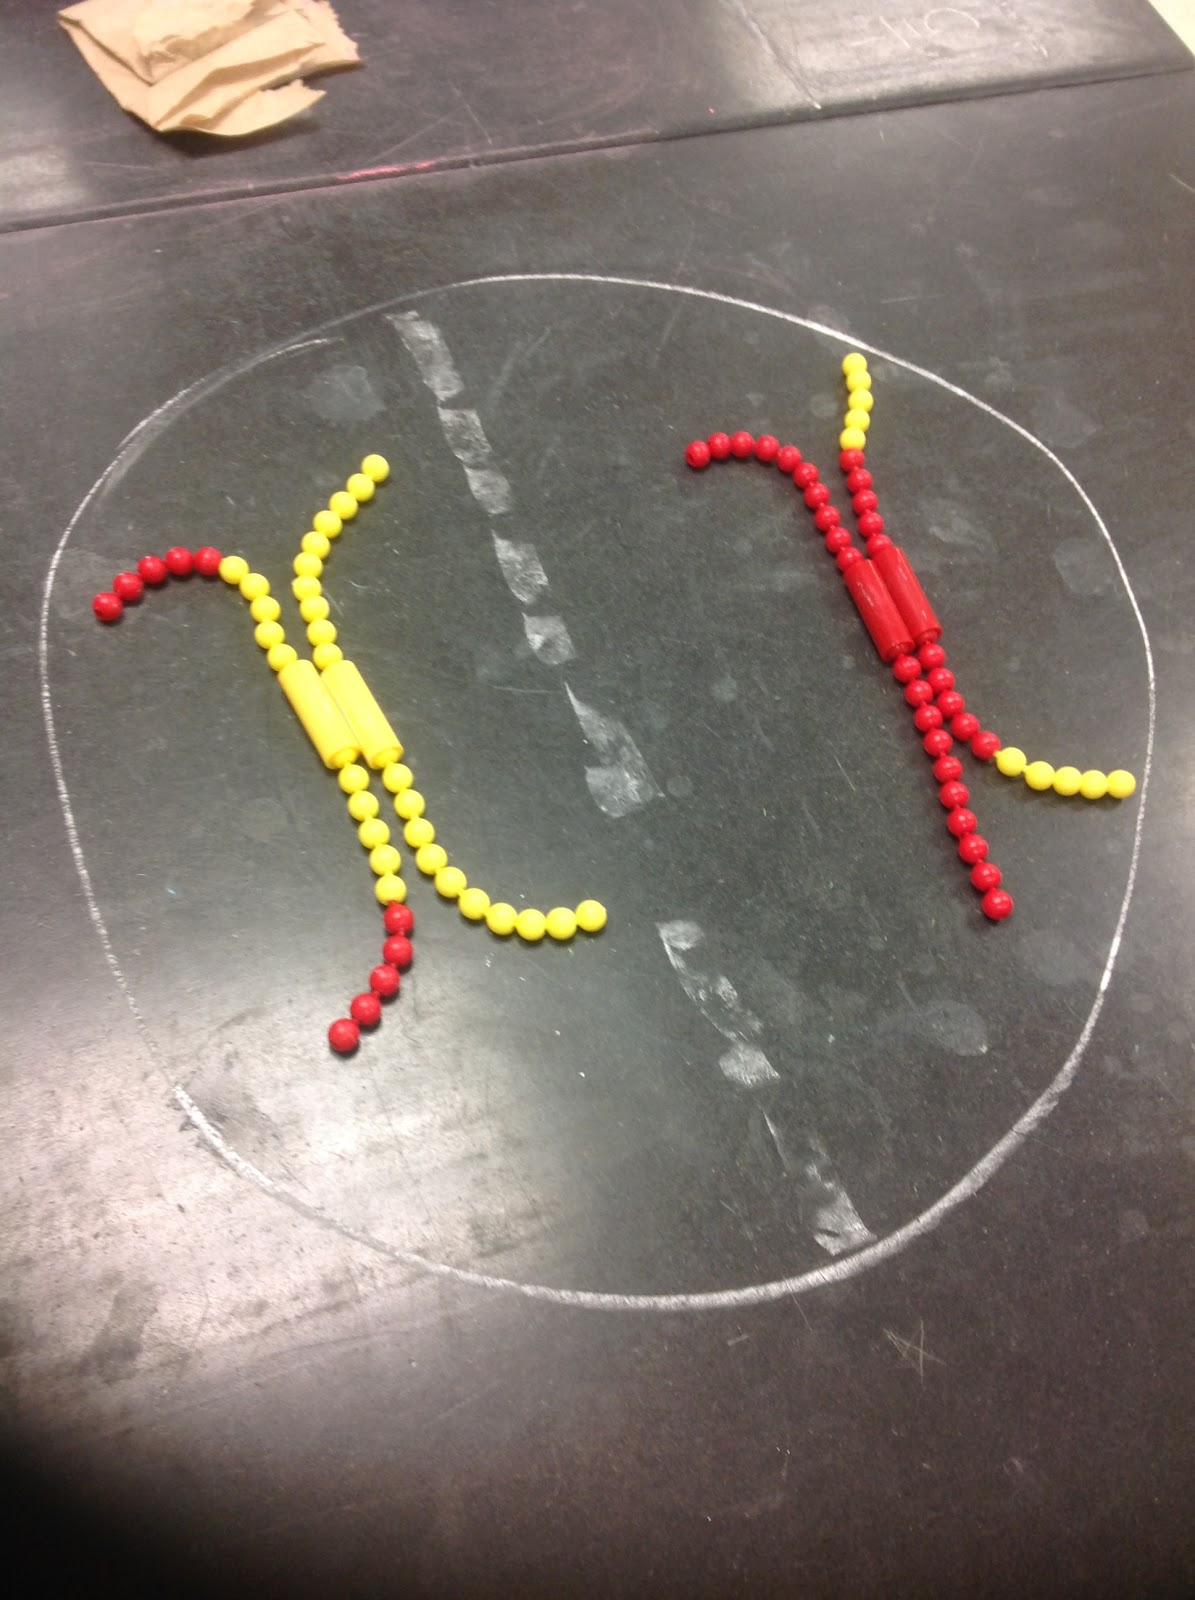
Prophase I - In this phase, the two homologous chromosomes pair up to exchange genetic information via crossing over as well as form a tetrad. This is different than prophase in mitosis where the nuclear envelope begins to disintegrate. The crossing over of chromosomes that is shown is the primary reason for genetic variation among species.
metaphase I - The newly formed tetrad said move to the center of the cell, between the two poles along the “metaphase plate”. In Metaphase I, the spindle fibers attach the centromeres of each chromosome. Unlike Metaphase in Mitosis, the kinetochores of the sister chromatids face the same pole.
Anaphase I - in this phase, the homologous chromosomes are separated and pulled to opposite poles along the spindle fibers. This differs from mitosis, where the sister chromatids are torn apart at the centromere and pulled to opposite poles.
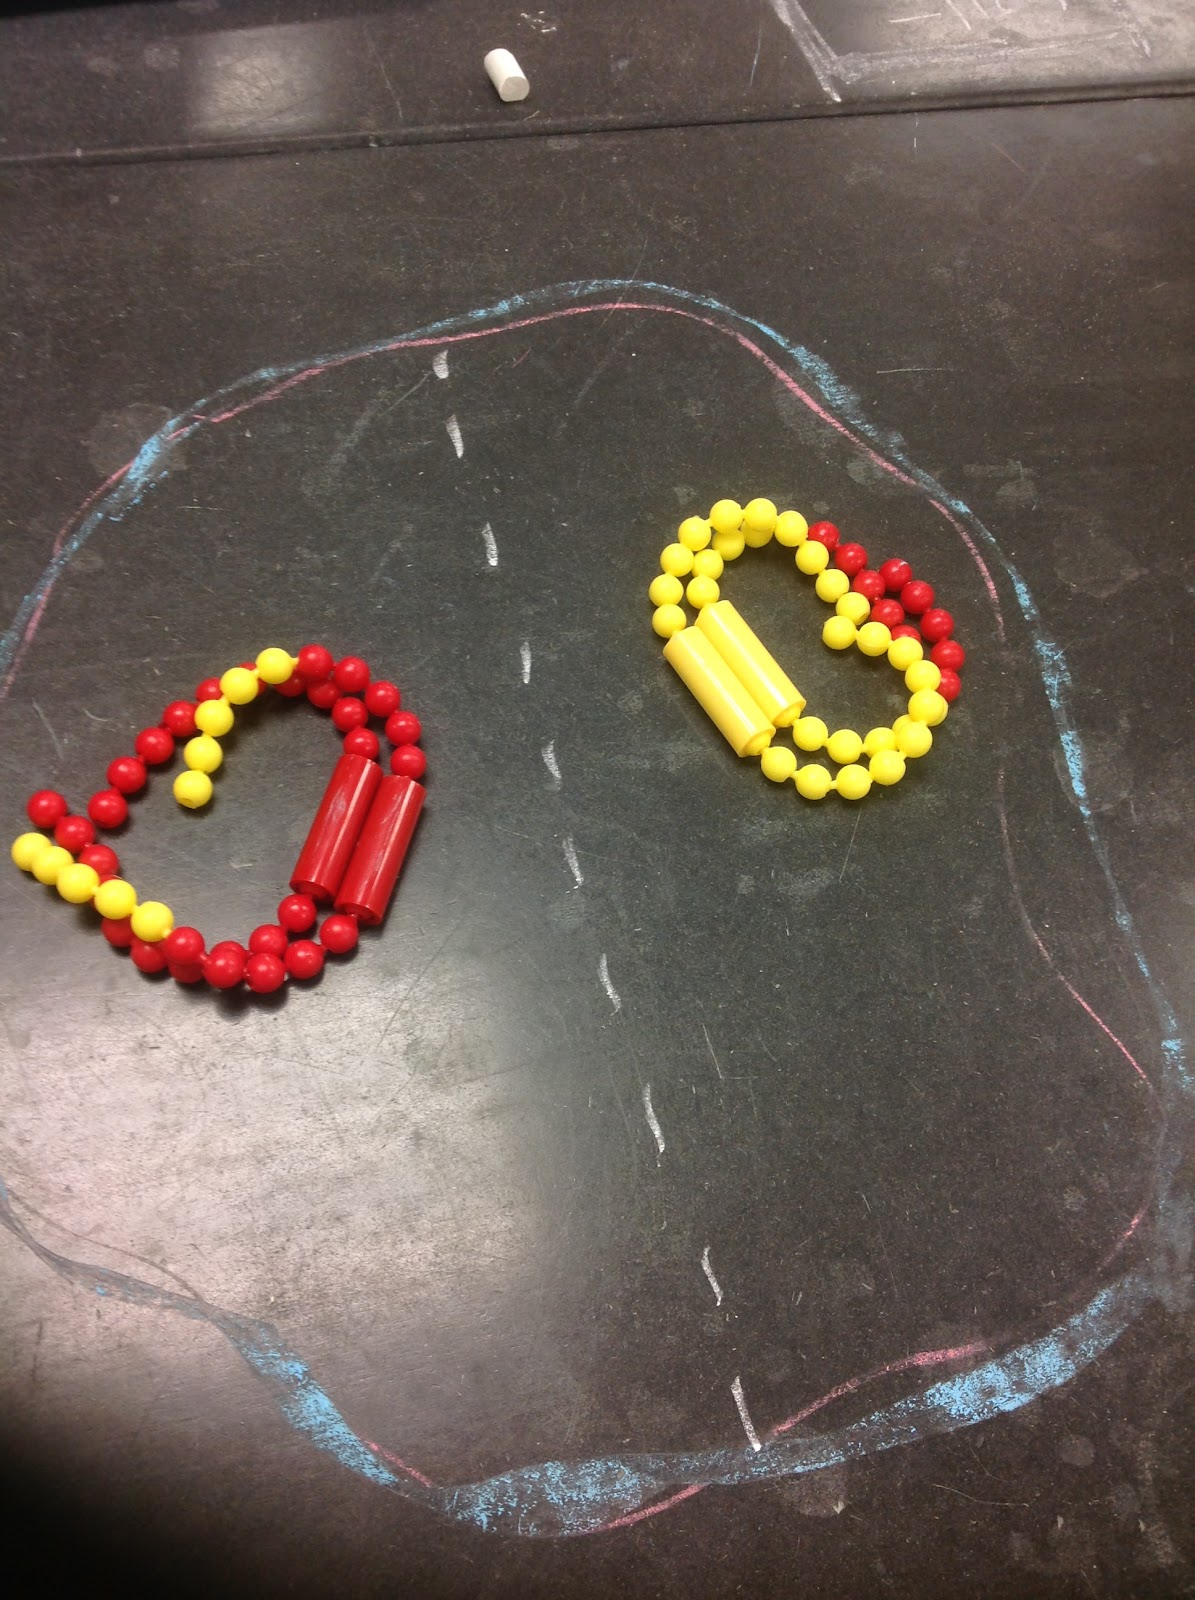
Telophase I - In this phase, a nuclear envelope forms, as well as a cleavage furrow. Then, two haploid cells are produced, both with chromosomes that still have both sister chromatids.


Prophase II - In this phase, we start off with the two haploid cells we left off with in telophase I. In oogenesis and spermatogenesis, these cells are the secondary oocytes and spermatocytes respectively. The nuclear envelope begins to break down and the centromeres move towards the poles.


Metaphase II - Again, the chromosomes line up in the middle of their respective cells along the metaphase plate. Then, similar to mitosis, the spindle attaches the kinetochores of each centromere to the opposite poles. This results in the separation of sister chromatids later on in Anaphase II.
Anaphase II - the sister chromatids are pulled apart by the spindle fibers towards opposite poles of each cell. They are now chromosomes. The cells begin to elongate in preparation for cytokinesis to occur.


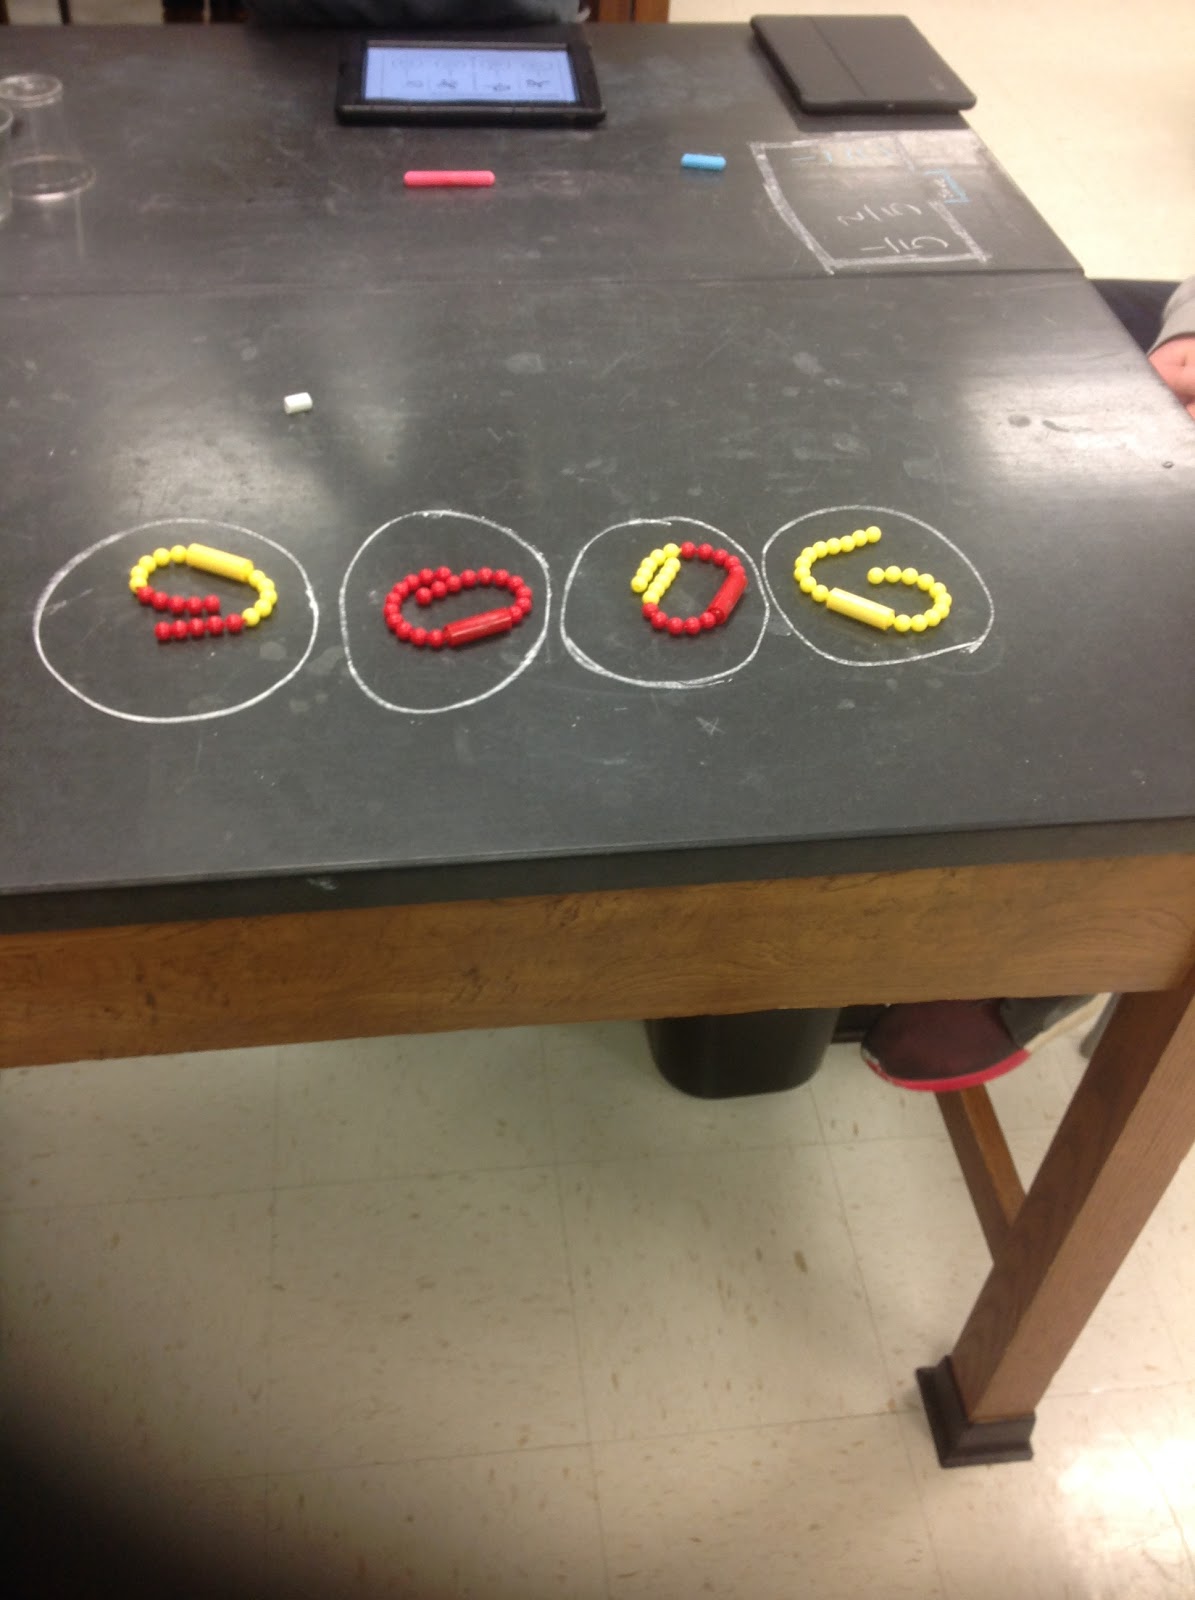
Telophase II - The final phase of meiosis, the chromosomes arrive at opposite sides of the cell. Cytokinesis occurs, forming genetically varying haploid cells. In oogenesis, one of these cells is a mature ovum, while the rest are polar bodies to be reabsorbed by the body. In spermatogenesis, all four haploid cells are spermatocytes to be used in sexual reproduction.


Data:


Discussion:
There are many stages of meiosis I and meiosis II. In the first stage of meiosis I, interphase I, chromatin is found coiled inside the nuclear envelope. Karyokinesis, the division of the nucleus of a cell is a process that occurs during interphase I. The nucleus must divide before the cell can divide. The centrosomes that are located within the plasma membrane are in close contact and yet they do not form spindles. In the next stage, prophase I, spindles begin to be formed within the plasma membrane. In metaphase I the centrosomes begin to line up where they attach to the kinetochores. The mitotic spindle continues to enlarge during this phase of meiosis I. In meiosis I a cell is able to divide into two diploid cells; however, in meiosis II those two diploid cells divide into four haploid cells. Meiosis plays a crucial role in sexual reproduction because it produces haploid sex cells which contain the right amount of chromosomes. Through meiosis greater genetic diversity is achieved which is beneficial because it gives organisms a greater chance to survive.  


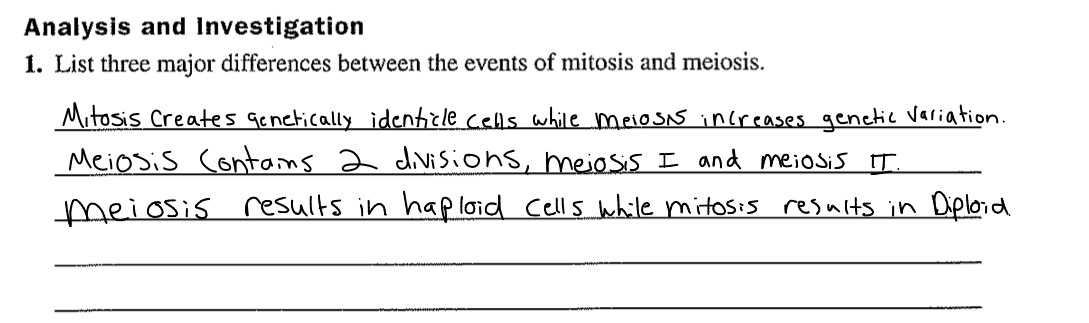
Conclusion: From our data we found that mitosis and meiosis have very different end results. For example, in meiosis the number of chromosomes are cut in half and four daughter cells are produced. Mitosis on the other hand produces two identical cells. We observed that meiosis I differs from mitosis in almost every phase, most noticeably in anaphase I and telophase I where the homologs are separated (As opposed to sister chromatids in mitosis) and the resulting cells are haploid (As opposed to Diploid in mitosis). Then, we were able to observe the similarities between meiosis II and mitosis, with the only major differences being that the cells in meiosis II are haploid and the resulting number of cells is four. Meiosis II acts out very similar to Mitosis, with spindle fibers of opposite poles attaching to kinetochores in Metaphase II, and the resulting separation of sister chromatids in Anaphase II causes there to be 4 gametes created after telophase II because the chromosomes from each cell are still attached to their sister chromatids.


Sunday, December 6, 2015

Photosynthesis Lab: Plant Pigment Chromatography and Light Reactions

Photosynthesis Lab Report
Exercise 4A: Plant Pigment Chromatography
Purpose:
The purpose of this lab was to separate and identify the different pigments in chloroplast by using chromatography paper and to also measure the rate of photosynthesis in chloroplasts. The pigments separate due to their solubility levels affecting how fast they move up the paper due to cohesion and adhesion, a quality of water brought on by hydrogen bonding.


Introduction:
All photosynthetic plant cells have multiple pigments that allow them to absorb various different wavelengths of light. Chlorophyll A, the primary pigment for most photosynthetic plants, reflects green light and absorbs most other wavelengths of light, giving leaves their signature green hue. Chlorophyll B also reflects green light and absorbs other wavelengths although this pigment is a different shade of green and thus allows for some additional wavelengths of light to be absorbed. It exists primarily to broaden the range of light that leaves can absorb. Other accessory pigments include xanthophyll and carotene, the former performing a similar function to Chlorophyll B by absorbing most wavelengths of light besides yellow light, and the latter protecting the more fragile pigments inside the thylakoid photosystems from excessive light damage.


Methods:
To begin, we used the rough edge of a United States quarter to crush the photosynthetic cells of a spinach leaf and free their pigments. This was done on top of a piece of filter paper, whose bottom edge had been cut into a point. We also made sure to mark the area where the solvent would rise to with a pencil, to insure that no pigment ended up soaked in the solvent. And to finish this step, the top of the filter paper was cut and placed onto a hook attached to the bottom of a cork. The results of this phase of the experiment can be seen in the below picture:
Picture 1: The spinach leaf and filter paper.


After the previous step was completed, solvent with a height of one centimeter was poured into a 50mL graduated cylinder. As stated previously, the height of the solvent was recorded with a grease pencil to insure that no pigment ended up soaked in the solvent. Once the tube was ready, the aforementioned filter paper was lowered into the solvent, stopping at the line marked with the grease pencil. The results of this phase of the experiment can be seen in the below picture:
Image 2: The results of the solvent moving up the filter paper and separating the pigments.


The solvent soon traveled up the filter paper, separating each of the pigments because of the differing solubilities of each of the pigments. Once the solvent just barely reached the top of the filter paper, the filter paper was removed from the tube and the height of each of the pigments’ peaks were recorded relative to the distance away from the grease pencil line. These results can be seen in Table 4.1, located in the Data section of Activity 4A.


Oh yeah, one more thing: don’t do this.
Image 0:
“Help, I’m stuck.”
Cork #6
2015-2015
Rest in peace. We will never forget your sacrifice.
It isn’t a good idea.


Data:
Table 4.1
Table 4.2
Note: Rf factor is calculated by dividing the distance the pigment in question migrated by the total distance the solvent front moved.


Discussion:
The only reason that these pigments separated so well is that their solubility varies in regards to the solvent placed at the bottom of the test tube. There are multiple reasons why solubility varies from pigment to pigment could provide insight into where the particular pigments are located in a typical plant cell. Since carotene traveled the furthest up the filter paper, this proves that carotene is located on the furthest out of all the pigments in this particular leaf. Carotene’s function, which is to shield the more fragile pigments from light damage, fits well with this hypothesis. And if carotene was located further outside the thylakoid and closer to the stroma within a typical chloroplast, it makes sense that carotene would need to be less soluble in order to not be dissolved into the aqueous stroma. And since carotene is so far away from the photosystems, it can be proven that carotene does very little, if any, capturing of light energy. Since we can adequately prove that carotene is located the furthest away from the cell, we can also isolate the functions and importance of each of the other pigments. Xanthophyll comes after carotene, which could suggest that xanthophyll also has protective properties since it reflects similar types of light to carotene. This pigment also seems to absorb at least some light energy, since it is close to the primary pigment and most important accessory pigment. Chlorophyll A is next, and it is probably further out than chlorophyll B in order to capture as much light energy as possible while still being safeguarded from damage by carotene and, to an extent, xanthophyll. It is still the prime reaction center pigment, as it is the deepest green, which allows for it to absorb as many different wavelengths of light sans green light. Chlorophyll B is last, either to be a fallback in case chlorophyll A is damaged or because it does not need to absorb as much light energy as chlorophyll A.


If a different solvent had been used in this experiment, the Rf values would be different. This is because every solute has a different solubility factor in regards to every solvent. However, while the Rf factor would change, their relative placement order (carotene -> xanthophyll -> chlorophyll A -> chlorophyll B) would remain unchanged, as it is indicative of their placement within a typical thylakoid.


Conclusion:
In regards to the evidence presented in the data of this lab, all information seems to be where it should be. The protective pigment—carotene—is the least soluble and the furthest away from the reaction center as it has the least light-capturing potential. Xanthophyll is higher up than the chlorophylls since it reflects similar wavelengths of light as carotene. And the chlorophylls are positioned in the reaction center in order of importance: A above, and B below. The data of this lab was invaluable in understanding how exactly thylakoids were structured in order to capture, process, and protect from light energy in the most efficient way possible. And it provides a perfect segue into the next activity, which deals exclusively with the chloroplasts’ ability to photosynthesize.


Exercise 4B: Photosynthesis and the Light Reaction
Purpose:
This segment of the lab is designed to understand how exactly the light reactions of a cell work under different conditions; of which, there are four. One where the chloroplasts are exposed to light, another where the chloroplasts are obscured from light energy, a third where the chloroplasts are boiled until they are dead, and a fourth where no chloroplasts exist to reduce DPIP, the substance taking the place of NADP+ in this experiment.


Introduction:
Chloroplasts have two different reaction centers. The first, being the light-reaction centers, are the thylakoids, which we have discussed in the previous exercise. To recap, thylakoids have different pigments that allow them to absorb different wavelengths of light, and they harness the captured light energy and split water into 2H+ and O2 to produce NADPH and ATP while releasing the oxygen as a byproduct. The other reaction center is located in the stroma, where the Calvin Cycle takes place. This cycle uses carbon dioxide and the NADPH and ATP produced during the light reaction steps to create sugar molecules that are used in cellular respiration. For the purposes of this experiment, only the light-reaction center where DPIP—substituting for NADPH—is reduced to carry electrons through the electron transport chain.


Methods:
To start, we prepared five different mixtures that would be transferred into cuvettes for testing. The first was a control tube, which had all necessary materials for photosynthetic activity with the exception of DPIP, meaning this mixture would be unable to reduce any material. The second was a tube identical to the first, except this one had one milliliter less of water and one milliliter more (read: actually has some) of DPIP. However, this mixture would be obscured from the light energy using a section of tinfoil. The third mixture was identical to the second, except this one has no obstructing foil. This mixture should be able to photosynthesize normally given no errors occur. The fourth was similar to the first two, except the chloroplasts were boiled instead of raw. This tube will test DPIP’s ability to reduce while no chloroplasts are alive to perform the necessary reactions. And the final mixture had no chloroplasts at all, which tests DPIP’s ability to reduce without any chloroplasts, whether they are alive or dead. The results of this can be seen in the following pictures:
Image 3: Each of the tubes with only DPIP (or lack thereof) and water before unboiled, boiled, or no chloroplasts were pipetted inside.


Image 4: The finished cuvettes packed and ready for testing.


Afterwards, the first cuvette was used to calibrate the colorimeter and establish a baseline. As we can deduce that no change in DPIP concentration will occur, as there is none, it functions as a very good baseline. Afterwards, all the other cuvettes were tested and the numeric value was placed in the time=0 column. After that, a heatlamp was turned on and a large beaker of water was placed in front of it to act as a heatsink. This way, only light energy will affect the cuvettes, not the heat of the light itself. The results of this can be seen here:
Image 5: The colorimeter just before testing a cuvette.


Image 6: The testing scenario.


After the cuvettes were placed behind the heatsink, they were allowed to stand for five minute intervals in between testing. Once all the values were recorded up to fifteen minutes, the experiment was halted and the values were lifted from the colorimeter database and placed into the below chart for interpretation.


Data:
Table 4.4
Table 4.4 documents the percent transmittance recorded by the colorimeter for each of the cuvettes, sans the baseline test tube. These data values were transmitted to the below graph for interpretation.


Graphs and Charts:
Graph 4.1


Discussion:
To begin, some of the data performed very oddly. Taking a look at the graph, it is clearly visible that the unboiled, light-exposed chloroplasts did not function as originally intended. It should have increased for each test, but the percent transmittance actually fell on the last trial. This could have either been from an error with the baseline, a typo in transition from colorimeter data to written data, or a mismatched cuvette. The latter scenario seems likely, as its value is roughly where the unboiled, light-exposed chloroplasts should be. Furthermore, the dark chloroplasts should not have increased to the value where they were. Since no light energy could reduce DPIP, it should have stayed relatively flat. This may have occurred because the foil was too small to seal the top, or the aforementioned switching in the final trial, as the dark and light unboiled chloroplasts both seem to be where the other should be in the final trial. Other than this, the boiled chloroplasts and the lacking chloroplasts performed relatively predictably, as they stayed flat. This occurred because there was nothing that was able to reduce the DPIP, and consequently, increase the percent transmittance as the blue liquid blocking the colorimeter laser would have been reduced in hue. Cuvette 3 should have had a higher percent transmittance than cuvette 2, but it did not experimentally play out this way due to the above reasons.
DPIP served as a substitute for NADPH, taking the role of the substance that carries electrons through the transport chain and to the Calvin Cycle. It is very obvious that this is true, as the DPIP visually reduced in blue hue in the cuvette that should have photosynthesized (cuvette 3, and cuvette 2 may have been exposed to more light than anticipated), and thus increased the percent transmittance. The electrons used to reduce DPIP can be found in water, which comes standard in every cuvette.
In the dark, DPIP should have been unable to be reduced as no light energy exists to split water and give electrons to it to reduce the substance, but in this experiment that was not actually the case. The dark, unboiled cuvette actually photosynthesized slightly more than the light-exposed one, either from an error in swapping the two similar cuvettes, an error on the colorimeter, or because it was actually photosynthesizing as a result of an error regarding the foil blocking the light energy.
The boiled chloroplasts were dead, meaning that the photosystems used to split water and reduce DPIP (photosystem 2) was destroyed and unable to function. As a result, no DPIP was reduced in cuvette 4, as supported by the graph.
To recap, the functions of each of the cuvettes were:
Cuvette 1: Baseline
Cuvette 2: Ability for live chloroplasts to reduce DPIP and photosynthesize in a dark environment, which they should have not been able to, but it did.
Cuvette 3: Ability for live chloroplasts to reduce DPIP and photosynthesize in a light environment, which they could, albeit with an error at the very end.
Cuvette 4: Ability for chloroplasts to reduce DPIP and photosynthesize while denatured or dead, which they could not.
Cuvette 5: Ability for DPIP to reduce without any assistance from chloroplasts or other such organelles, which it could not.


Conclusion:
From the evidence above and the trends that we would typically expect in chloroplasts, this exercise proved to be riddled with errors. Chloroplasts photosynthesized in the dark but did not in the light. Imagine what an odd world that would be, plants using energy from nothing to perform light-reaction functions but being unable to in the presence of actual light energy. Fortunately, however, the other two tested cuvettes behaved predictably, rising and falling in tandem with each other, which we can write up as being intricacies with the machine rather than the shifting in color of the DPIP. Regardless of how many errors poked holes through our analysis, it still proved to be relatively worthwhile in understanding how exactly chloroplasts perform their functions. The DPIP was actually visible in comparison to NADPH, and we were able to see the mixture reduce as the experiment’s fifteen-minute time limit ticked on.


References

  • Unless otherwise stated, all information related to photosynthesis and plant pigmentation has been synthesized from Jane Reece’s Campbell Biology AP Edition Textbook and Collegeboard’s Lab Four: Plant Pigments and Photosynthesis.
  • Tables 4.1, 4.2, and 4.4’s outlines have been taken from Collegeboard’s Lab Four: Plant Pigments and Photosynthesis, but the information is original to the experiment.
  • Paraphrased procedures have been synthesized from procedures found in Collegeboard’s Lab Four: Plant Pigments and Photosynthesis.
  • All pictures are original from the in-class experiment.


Trejo and Jason's Photosynthesis Lab


Purpose: The purpose of this lab was to identify the different pigments in chloroplasts by using chromatography paper. The paper is dipped in a solvent and the pigments separate based on their solubility levels and move up the paper due to cohesion and adhesion, two properties of water. In this lab we examined the rate of photosynthesis of several samples of chloroplasts as certain factors were changed.

Introduction
Chloroplasts use light as a source of energy for the process of photosynthesis. In this lab, we first used a solvent and chromatography paper to separate the pigments in a spinach plant leaf. The pigments separated due to their differing solubility levels and also because of two properties of water, cohesion and adhesion which help the pigments move up the paper. Second, we studied the percent light transmittance of chloroplasts in different states to prove that they do indeed absorb light.

Methods: First, we took a sheet of chromatography, cut one end to a point to prevent over saturation of the paper, and then attached the other end to a hooked cork for stabilization of the chromatography paper and sealing of the vial. We then used a coin to smear the spinach cells containing chloroplasts onto the chromatography paper. In the vial, we put just enough solvent to wet the tip of the chromatography paper, inserted the paper attached to the cork and sealed it tight.


The chromatography paper cut to a tip, attached to the cork, and smeared with spinach leaf cells.

Once the pigments began to move up the paper, we waited until it reached about the top and quickly took it out from the solvent. Unfortunately the latter part of this process was inhibited by our hasty jamming of the cork in the vial, rendering it stuck and unable to be removed. Nevertheless we were able to observe a distinct separation of pigments due to varying solubilities of pigments. We then went ahead and used measurement data from another lab group with visually similar results.(Table 4.1)
The separation of pigments and an immobile cork.


The result of about 45 minutes worth of trying to remove a cork fitted too tight into the vial.
In any similar experiments, the scientist should be careful to leave enough cork for it to be removed when needed.


Data:
Table 4.1

Table 4.2


Discussion: Through this lab we found that carotene went up the paper the furthest, which  explains why it has the highest Rf value. Xanthophyll went up the second furthest, chlorophyll A followed, and chlorophyll B traveled least. The placement of the pigments on the chromatography paper was directly related to their solubility. The lower the solubility, the lower the Rf value, indicating a lower placement on the chromatography paper. The further a pigment travelled meant it had a higher rate of photosynthesis. This shows why carotene traveled up the chromatography paper the furthest.

Conclusion: In order from least soluble to most soluble, we found Chlorophyll B to be the least soluble, then chlorophyll A, Xanthophyll, and finally Carotene being the most soluble in the given solution. This data provides evidence that the reaction center contains chlorophyll b and the other pigments are increasingly further from the Thylakoids, with Carotene being the farthest, acting as a protective pigment.


Exercise 4B: Photosynthesis and the Light Reaction
Purpose: This experiment was used to observe light reactions given chloroplasts under different conditions. We used DPIP to take the place of NAD+ which would be reduced in the lab. We had 4 different chloroplast conditions. Boiled Chloroplasts, chloroplasts exposed to light , chloroplasts not exposed to light, and no chloroplasts. We also had a solution with chloroplasts and no DPIP to act as the control group.

Introduction: Chloroplasts use light to power photosynthesis. Even a small amount of light can start this process which is necessary for life. Light is essential for photosynthesis, without it photosynthetic processes would not be possible. Nonetheless, the longer chloroplasts are exposed to light the greater the amount of the product that photosynthesis is able to produce.

Methods: First, we prepared different mixtures in 5 test tubes containing the different chloroplasts conditions. The first was used as a control and contained the phosphate buffer, water, unboiled chloroplasts, and no DPIP preventing it from reducing at all. The second was almost the same, with 1 ml less of water and 1 ml of DPIP. The third was exactly the same as the second. The fourth contained the same as the previous, except instead of unboiled chloroplasts, the chloroplasts in the fourth mixture were boiled. Finally, the last mixture coco gained the Phosphate buffer, water, DPIP, but no chloroplasts whatsoever.

After all the mixtures were prepared, they were packaged into cuvettes and sealed. The only difference now is that the cuvette containing mixture 2 was covered in aluminum foil, preventing any light penetration.


Cuvette 1 was used to establish a baseline for the experiment, then all the other cuvettes were tested for light transmittance and the data was recorded under 0 seconds. The cuvettes were then placed in front of a heat lamp behind a large beaker of water that acted as a heat sink to make sure that the cuvettes were only being affected by light energy and not heat energy.


The cuvettes were then taken and retested for percent transmittance at 5 minute intervals, up to 15 Minutes, using the colorimeter.


Data:
Our data turned out to be a little odd, with no particular pattern of transmittance.

Graphs and charts:

Discussion:

Our data did not turn out as expected, the unboiled/dark cuvette should not have had a change in the transmittance percentage. The amount of time that the cuvettes were exposed to light affected the transmittance of each individual cuvettes. Since it was kept in a dark environment; however, there are several ways this lab could have been jeopardized. There was a light source near our lab station which could have started a photosynthetic process within the unboiled/dark cuvette. Also, light could have reached the cuvette when we took it off its aluminum cover to find the transmittance. To do this lab properly we filled up a flask with water and placed it in front of the light source so that it wouldn't have a negative effect on the chloroplasts within the cuvettes. The heat given off by the light source was negated by the flask filled with water. Since water has such a high heat specific it was able to absorb the heat and keep the cuvettes from being harmed. In relation to the light cuvettes not photosynthesizing and the dark doing so, light was probably mistakenly allowed into the dark cuvette, and in the light cuvette perhaps boiled chloroplasts were used instead of unboiled.

Conclusion: Our lab was full of inconsistencies which can be clearly seen by our data.  These inconsistencies were most likely a result of a flawed procedure in which light mistakenly entered the “dark” cuvette and the “light” cuvette most likely had an error in the type of chloroplast administered. This caused results that were opposite from intended. The “dark” cuvette photo synthesized, while the “light” cuvette did not! This is quite obviously a large error, however, the experiment proved to be valuable in the fact that we were able to visually observe the DPIP(NADPH substitute) reduce. Also, from understanding our errors we were able to study the intended effects and the photosynthetic processes of a chloroplast.